
The Arctic will open, but not for everyone at once. Summer sea ice keeps shrinking, and the routes over the top of the world get a little longer each season. The question is no longer whether ships can sail there, but who will use the routes, for what, and who gains. This column answers with forecasts: each has a probability, a date and a way to check it, so you can judge us later.
Updated 28 October 2026. We have rewritten this column as a forecast. It now covers the 2026 Strait of Hormuz crisis, the EU's coming ban on Russian LNG, the first oil from Rosneft's Vostok Oil project, the 2026 shipping season, a voyage-cost model you can download, and a table of forecasts we will score.
The short answer
- Shipping routes. The Northern Sea Route (NSR) along Russia's coast stays seasonal and Russian-run, and is used mainly to move Russian energy east. We put its cargo at about 50 million tonnes in 2030 (80% range 40–70), against Russia's own targets of 70 to 150. Through 2035 it carries well under 3% as many transit voyages as Suez.
- Containers. Asia–Europe container lines will not switch. In our model the Arctic is cheaper than Suez on only about a third of summer voyages, and an independent 2026 study finds less. It wins only when the southern route is closed, or when Russia waives its fees.
- Oil and gas. Arctic crude and LNG flow east to China. For energy leaving the Russian Arctic for Asia, the NSR is cheaper than Suez on 93–100% of simulated summer voyages. Yamal LNG loses its European buyers on 1 January 2027, and its ice-class fleet can carry only about half its recent volume to Asia.
- Winners and losers. Clear winners: China (discounted energy, a second route, influence) and Norway (the reliable supplier that is neither in the Gulf nor Russian). The United States gains if the Greenland agreement and Alaska LNG go ahead. Russia gains volume but loses leverage to China. Japan and South Korea come out mixed. Hardly anyone loses from Arctic shipping before 2035.
- The 2026 Hormuz crisis makes every barrel and cargo from outside the Gulf more valuable, and so strengthens each of these trends.
What changed in 2026
- The Gulf shock. Qatar shut its Ras Laffan LNG complex on 2 March after an Iranian drone strike, and in late September extended its force majeure into late November and early December. The IEA's October report puts oil flows through the Strait of Hormuz at 10.9 million barrels a day in September, up from 7.6 million in August, when they were 13.1 million below pre-war levels. It expects world oil supply to fall by 5.8 million barrels a day this year. IEA, Oil Market Report October 2026; Al Jazeera; The National
- Europe's LNG ban. The EU banned Russian LNG under short-term contracts from 25 April 2026 and bans it under long-term contracts from 1 January 2027. Despite the Hormuz crisis, the Commission says there will be no reversal. Buyers rushed in first: the EU imported a record 12.18 million tonnes of Russian Arctic LNG in the first nine months of 2026. REPowerEU; High North News; urgewald
- A record transit season. By 30 September the Centre for High North Logistics (CHNL) counted 104 NSR transits, more than the 103 in all of 2025, carrying about 3.7 million tonnes, 15% more. Eastbound tankers were the largest group: 22 voyages with about 2.1 million tonnes, mostly crude. Four Asia–Europe container voyages had no Russian port at either end, against one in 2025. CHNL expects about 150 transits and more than 4.5 million tonnes; Rosatom says more than 7 million. CHNL; Container News
- Vostok Oil starts. Rosneft loaded its first crude at the new Sever Bay terminal in early September, onto the Arc7 ice-class tanker Valentin Pikul. Its first cargo via the NSR was unloaded at Yantai in China in late October. S&P Global; Baird Maritime
- Greenland. The US–Denmark–Greenland security agreement was signed on 22 September 2026. Greenland's parliament held its first reading on 10 October, and the Danish parliament debates it from 12 November, with a vote on 19 November. Copenhagen Post; Reuters
- The war. US-brokered talks between Russia and Ukraine continue, but there is no ceasefire. Al Jazeera; CFR
The ice: slower than headlines, faster than planning
September sea ice, the end-of-summer minimum, averaged 7.05 million km² in 1979 and 4.81 million km² in 2026. The trend is a loss of about 0.74 million km² per decade, roughly 12% of the 1981–2010 average. The 2026 daily minimum, 4.60 million km² on 12 September, tied for the tenth lowest on record; the record is 3.39 million km² in 2012. The Arctic warmed nearly four times faster than the world between 1979 and 2021. NSIDC data; NSIDC, 2026 minimum; NASA; Rantanen et al., 2022
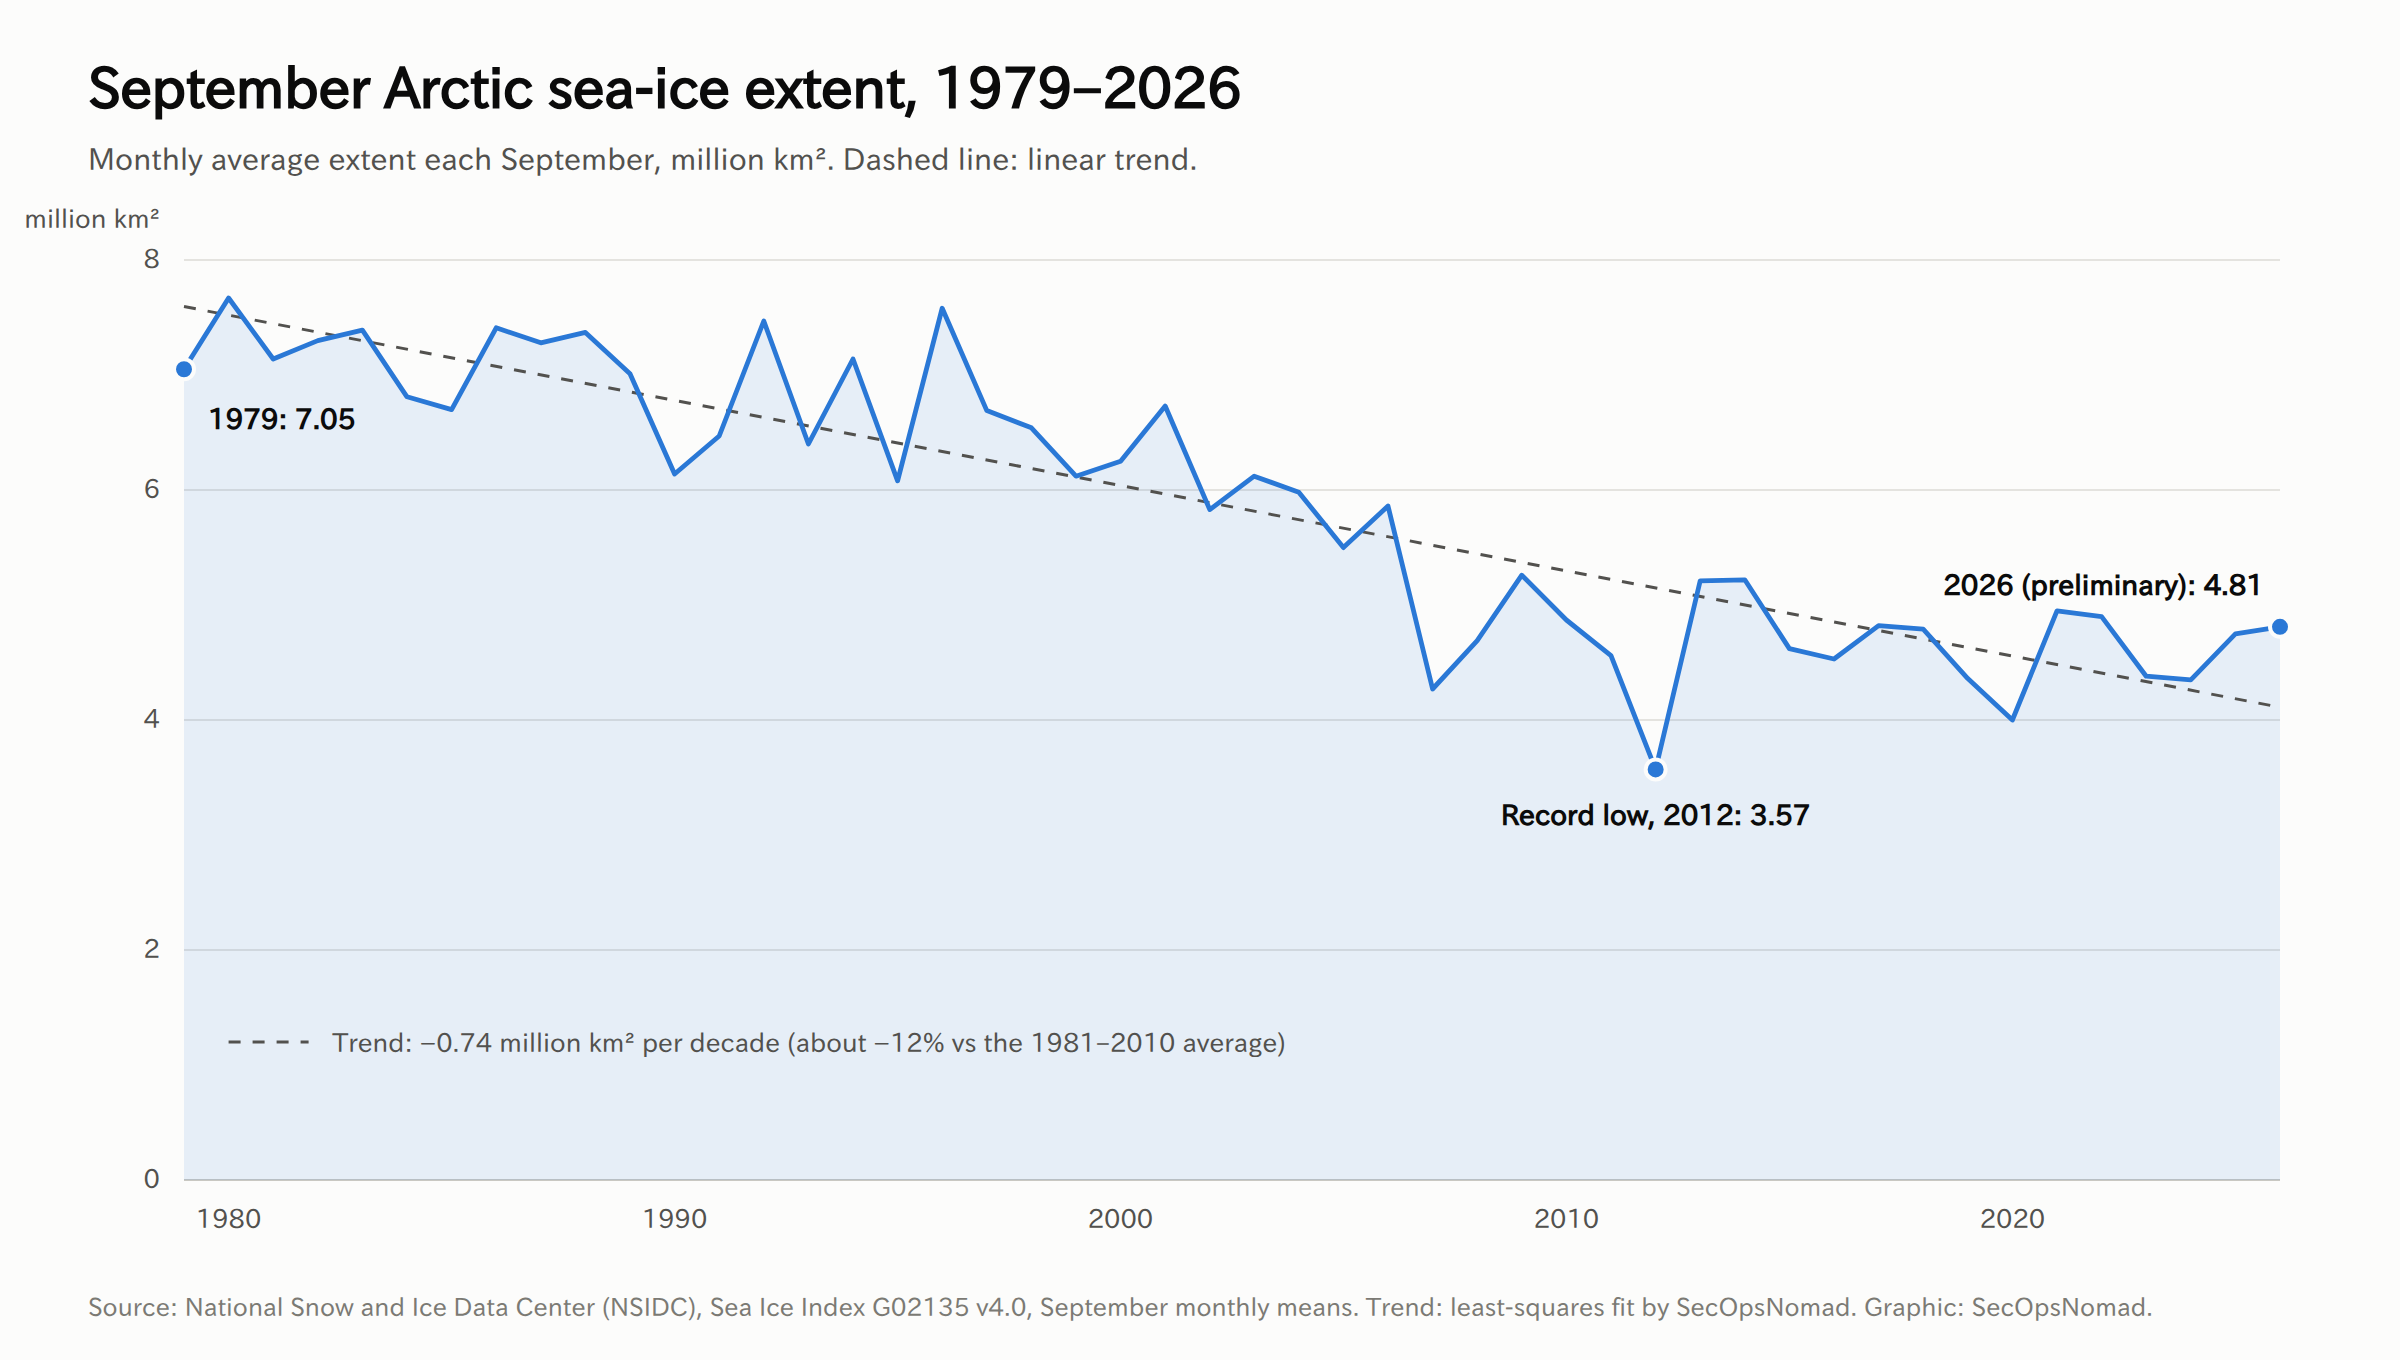
The IPCC judges a practically ice-free September (less than 1 million km² of ice) likely at least once before 2050 under every scenario it assessed. A 2023 study that adjusts models to observations says the first could come in the 2030s. For shipping, the useful measure is how long the season lasts. Climate models project that, by mid-century, ordinary open-water ships could use the NSR in most Septembers, and ships with modest ice strengthening could cross near the pole. Arctic routes between Europe and Asia would then be about 10 days faster than the alternatives, and the navigable periods would be twice as frequent. The ice still returns every winter. IPCC AR6; Kim et al., 2023; Smith & Stephenson, 2013; Melia et al., 2016
The base rate: Russia's targets versus what was shipped
Before forecasting, check how earlier forecasts did. Russia's have missed badly.
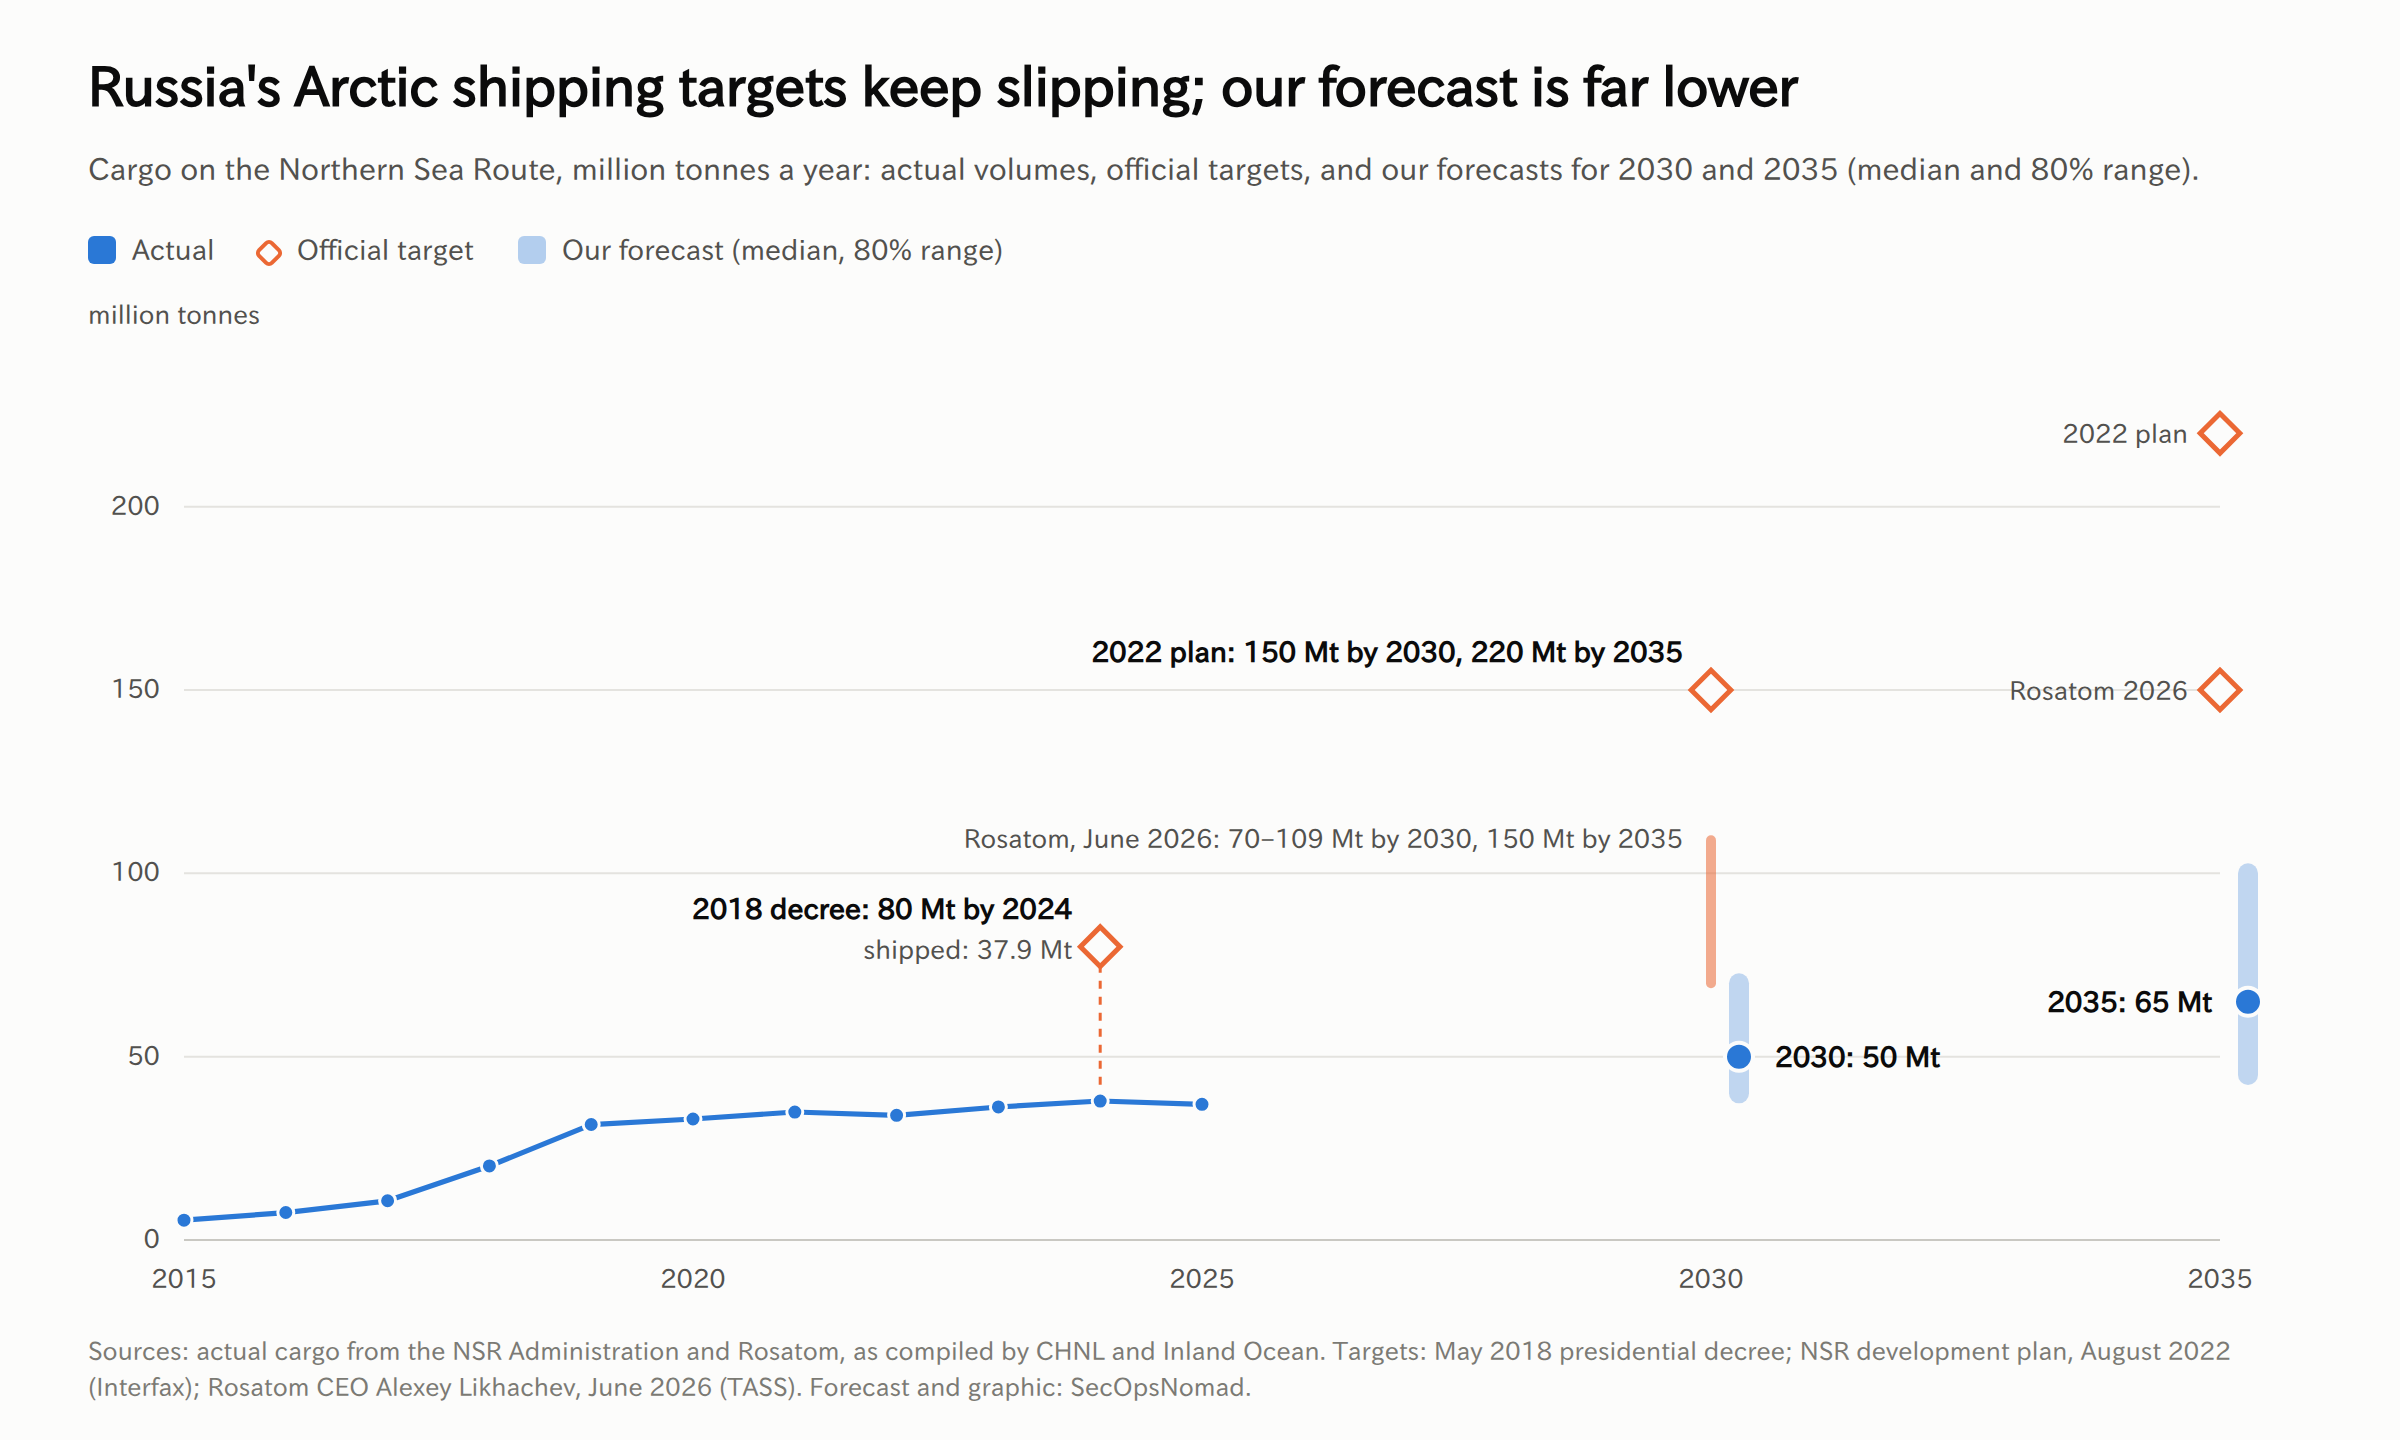
- 2018: a presidential decree set 80 million tonnes by 2024. The NSR carried 37.9 million that year, 47% of the target.
- 2022: the NSR development plan set 150 million tonnes for 2030 and 220 million for 2035.
- 2026: Rosatom's chief executive called 150 million by 2035 the base case, and its first stage now aims for 70–109 million by 2030.
Cargo has been flat at 34–38 million tonnes since 2020, and was 37.0 million in 2025. Interfax, 2022 plan; TASS, June 2026; Rosatom; High North News; gCaptain; Inland Ocean
How we get to about 50 million tonnes in 2030:
| Part of NSR cargo | 2025 | 2030, our central case | Why |
|---|---|---|---|
| Existing flows: Yamal LNG, Gulf of Ob oil, Norilsk metals, supplies | about 37 | 30–34 | Yamal LNG loses Europe in 2027, and its ice-class fleet limits deliveries to Asia |
| Vostok Oil (Rosneft) | 0 | about 12 | First oil in September 2026; target of 30 million tonnes a year from late 2027, but ice-class tankers are short |
| Arctic LNG 2 (Novatek) | 1–2 | about 5 | Sanctioned; China is the only buyer; the third production line is delayed to 2028 |
| Total | 37.0 | about 50 | 80% range 40–70; Rosatom's own lowest figure, 70, is our upper end |
Shipping routes: what will happen
The Northern Sea Route: an energy road with a toll Russia sets
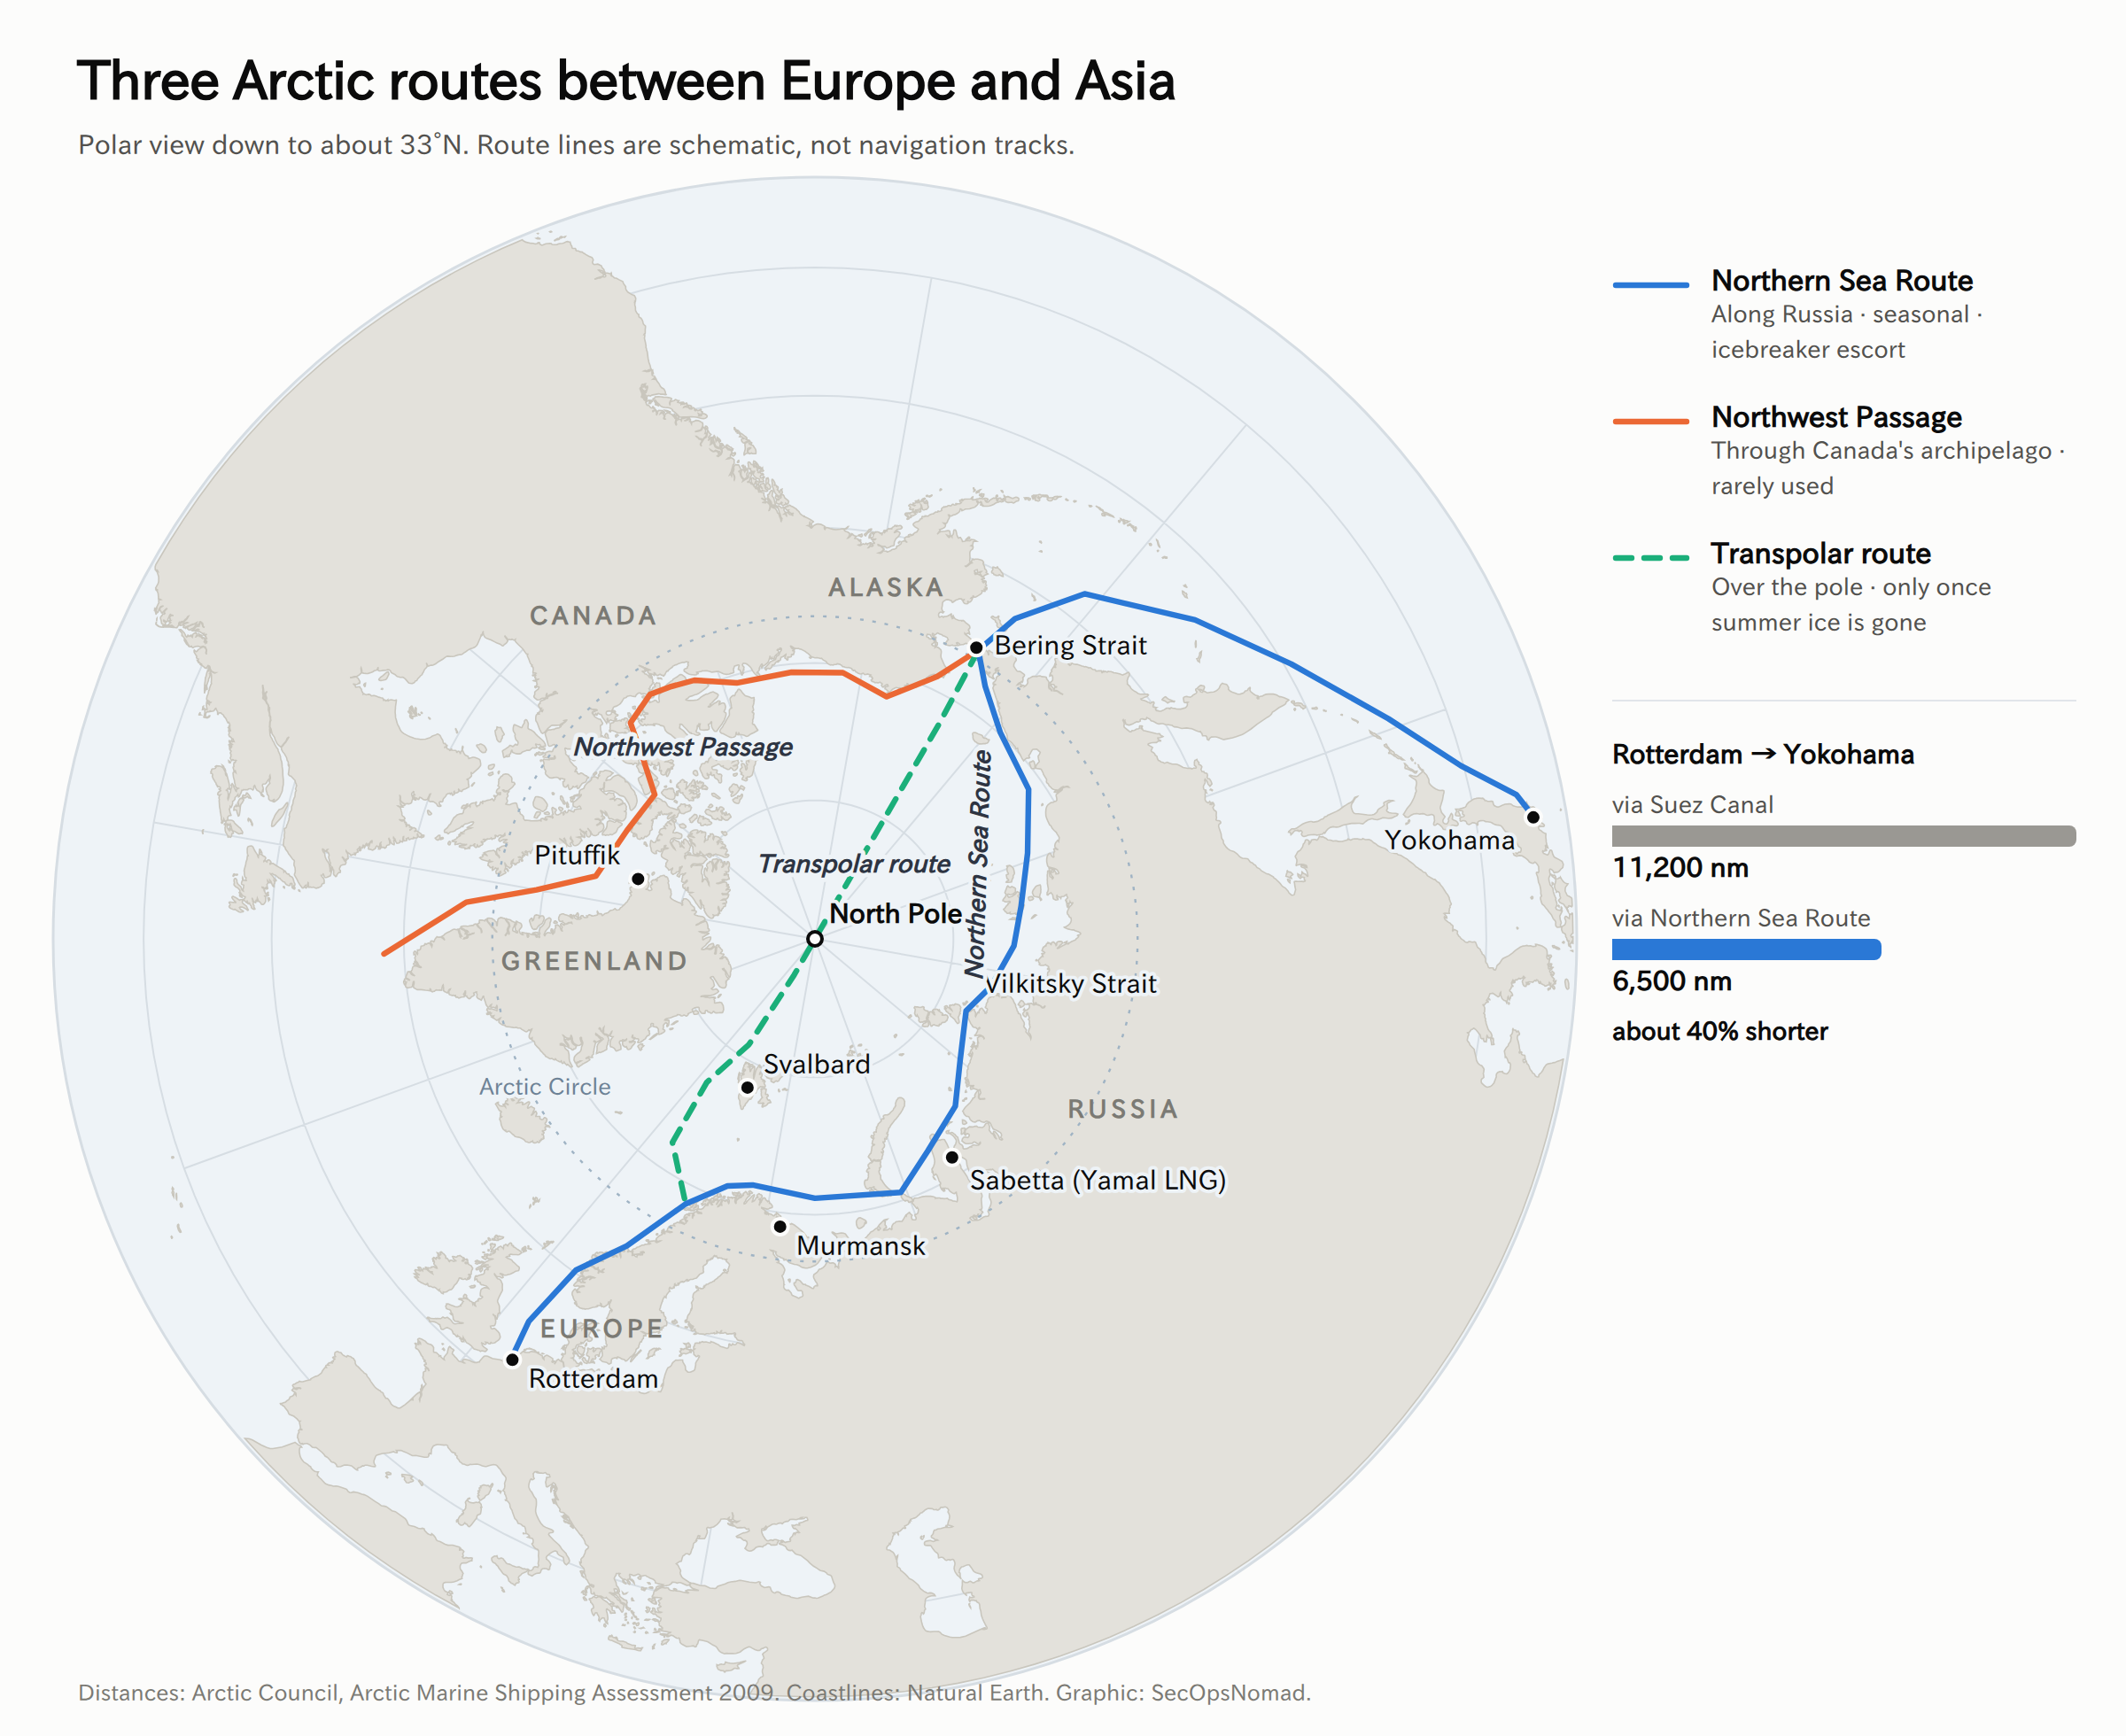
The NSR's advantage is distance: Rotterdam to Yokohama is about 11,200 nautical miles via Suez and about 6,500 via the NSR, roughly 40% shorter. Its handicaps are season, ice, shallow straits, Russian permits and sanctions. To see which wins, we built a simple voyage-cost model and ran 50,000 simulated summer voyages for three typical cases. It includes hire, fuel, tolls, Red Sea war-risk insurance, Arctic fees and ice delays, each drawn from a range. Arctic Marine Shipping Assessment; Port Economics
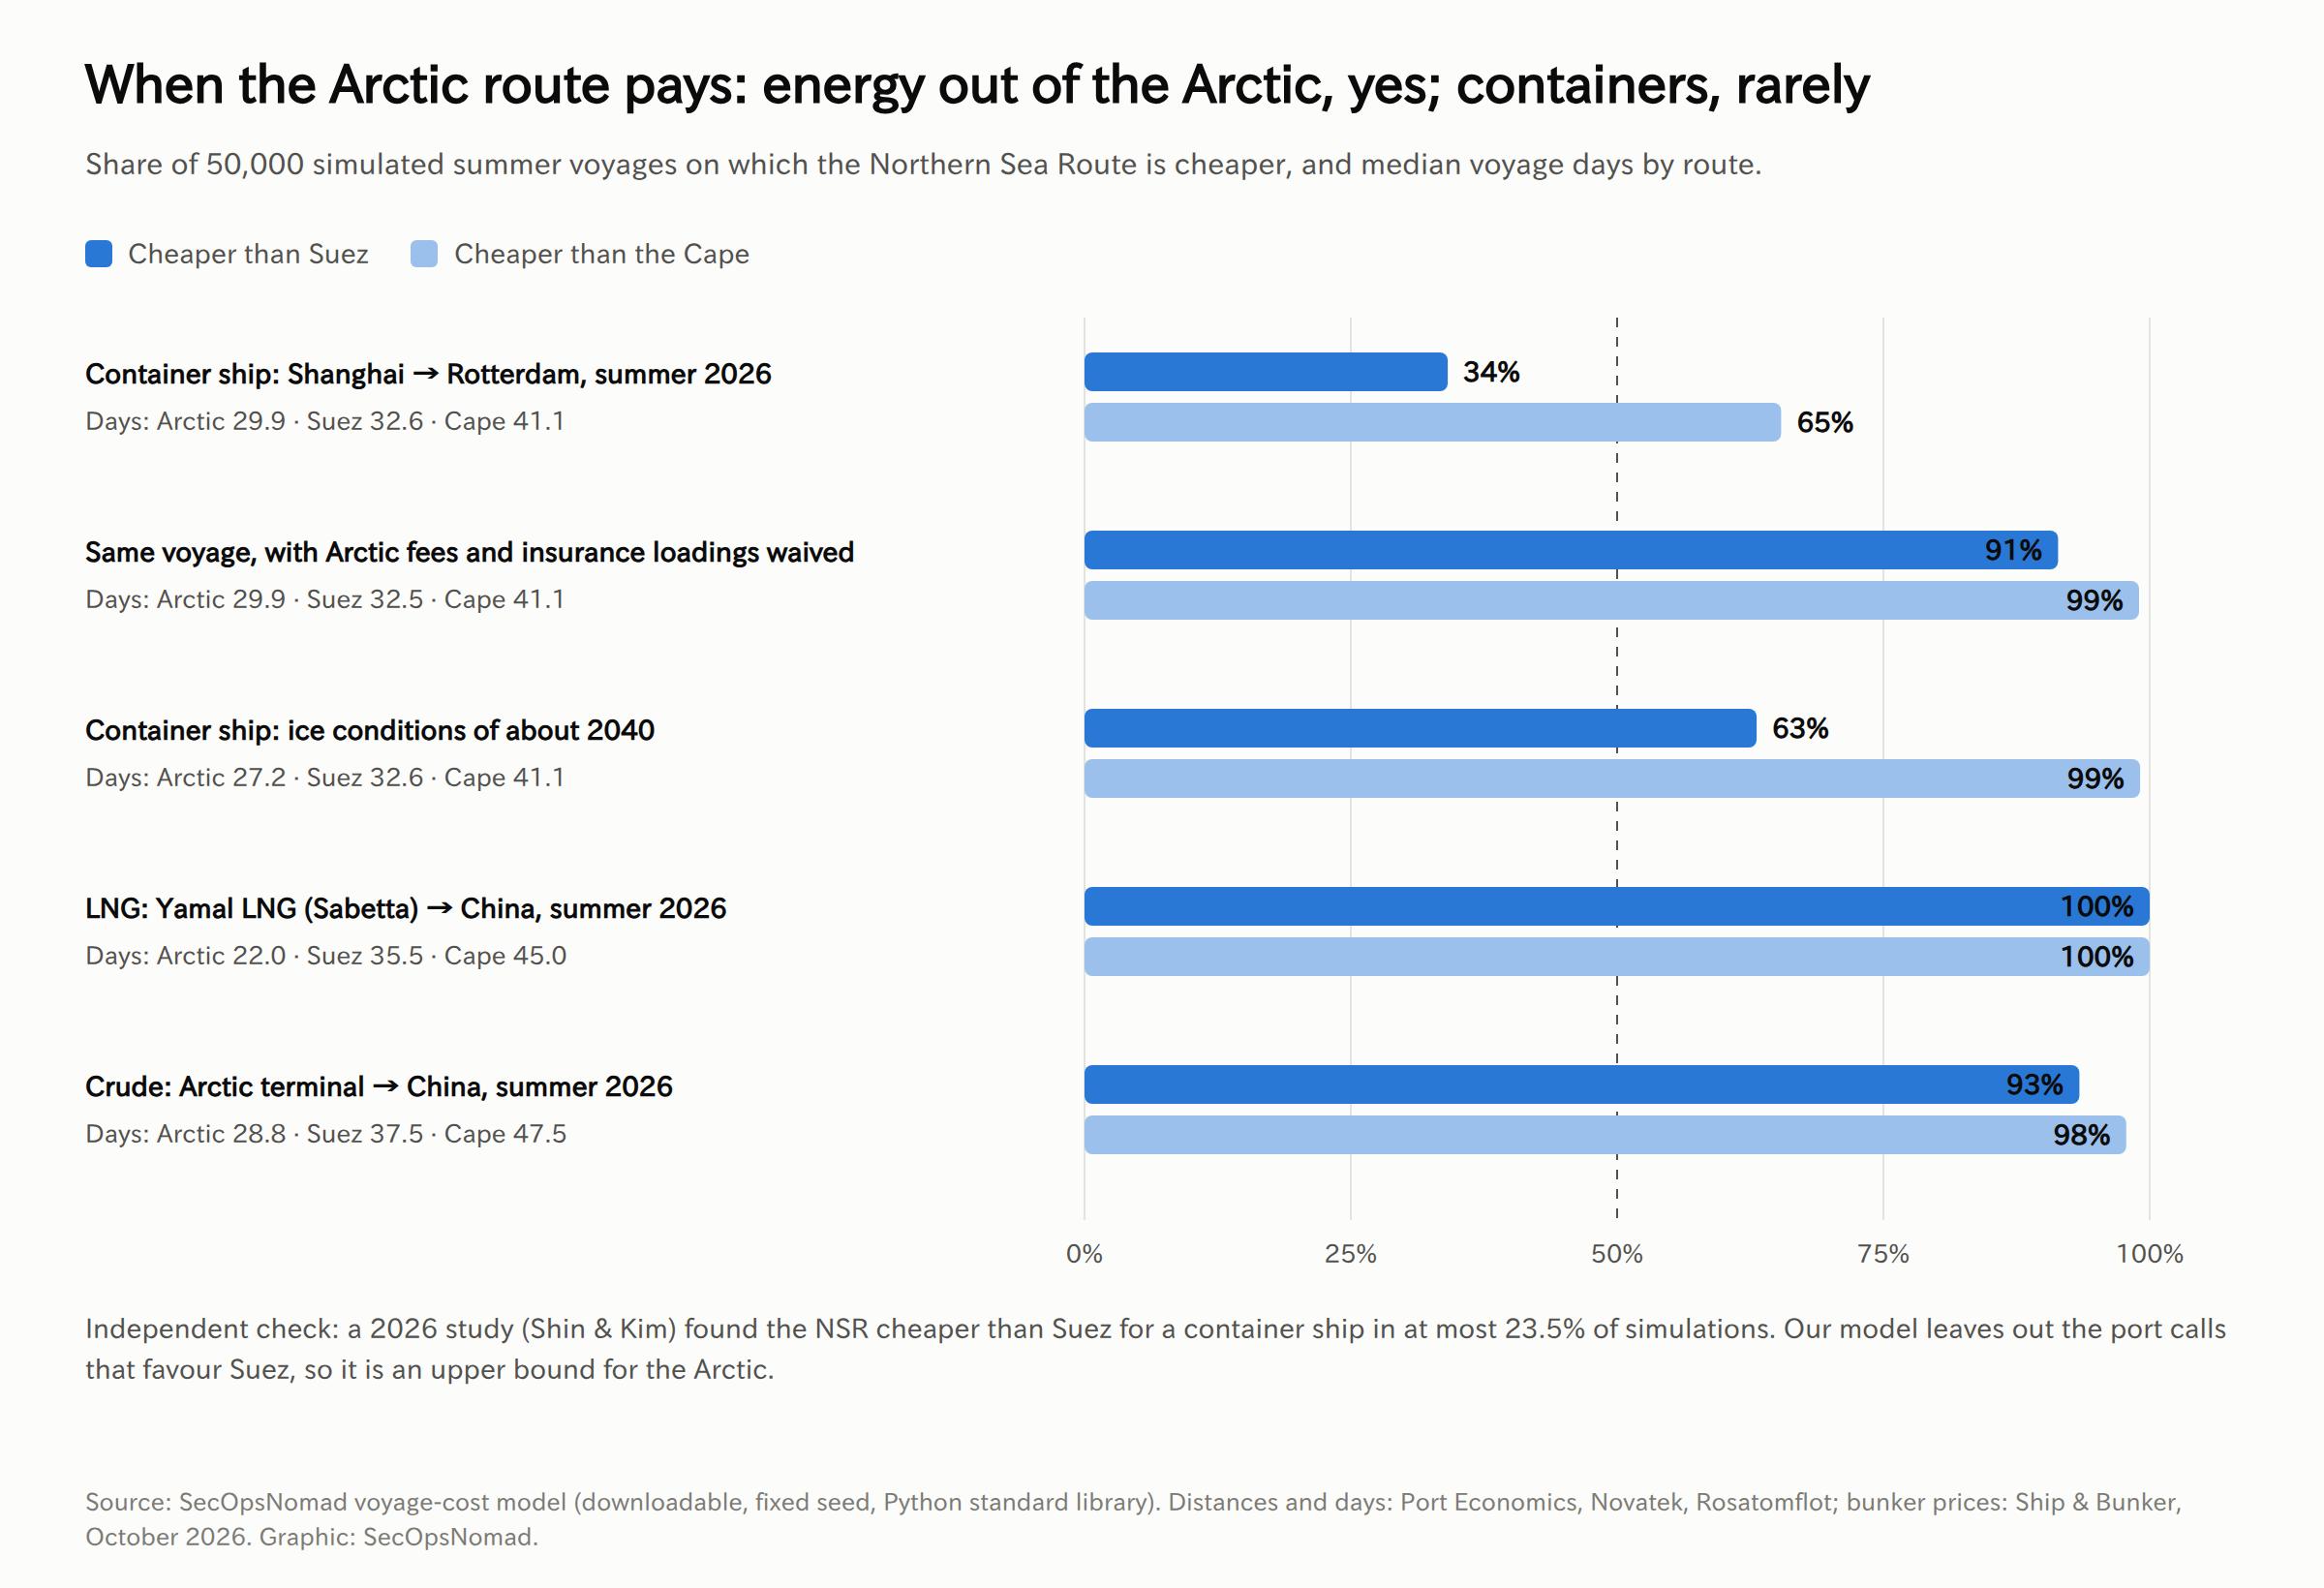
What the model shows:
- For energy leaving the Arctic, the NSR wins almost every time. An LNG carrier from Yamal to China saves about 13 days and a median of about $4.0 million a voyage, or $2.7 million even with no Red Sea war-risk premium. For a crude tanker the NSR is cheaper on 93% of voyages, and 84% without that premium. The cargo already starts in the Arctic, so there is no detour to pay for.
- For containers between China and Europe, it usually loses. The route is 25% shorter, but slow ice legs and delays cut the time saving to about three days. Fees, ice-class costs and insurance then eat the fuel saving. The NSR is cheaper than Suez on 34% of voyages, and cheaper than going round the Cape on 65%. An independent 2026 Monte Carlo study found it cheaper than Suez in at most 23.5% of cases, and only 1.4% in winter. Our model leaves out the port calls that make Suez routes pay, so read ours as an upper bound. Shin & Kim, 2026
- The swing factor is political. Waive the Arctic fees and insurance loadings and the NSR wins 91% of container voyages. Rosatom sets those fees, and has argued for keeping them low and subsidised during the route's roll-out, until cargo reaches about 109 million tonnes. Russia, with China, can make the route competitive for chosen customers. Market forces cannot. Interfax; TASS
- Thinner ice helps, but it does not change the season. With ice conditions of about 2040, the container case rises to 63% against Suez. A route that is open for four or five months a year still cannot carry a weekly, year-round liner service.
Forecast: NSR transit cargo, as CHNL counts it, grows from 3.2 million tonnes in 2025 (about 4.5 million expected in 2026) to about 8 million in 2030 (80% range 4–15), almost all of it Russian or Chinese. Through 2035, NSR transits stay below 3% of Suez transits (90%).
Container trade: China's niche, not the industry's switch
Chinese carriers are building a summer niche. Sealegend Shipping planned eight voyages from Ningbo to Felixstowe, Rotterdam, Hamburg and Gdynia between August and October 2026, and NewNew Shipping plans up to 12 voyages between China and Arkhangelsk. In 2025, according to Rosatom, the container ship Istanbul Bridge reached Felixstowe from Ningbo in 20 days. The big Western carriers, including MSC, CMA CGM and Hapag-Lloyd, have pledged to stay away, and their customers need reliable weekly sailings all year. Rosatom Newsletter; Interfax; World Nuclear News
Forecast: Maersk, MSC, CMA CGM or Hapag-Lloyd announces a scheduled NSR service before 2030: 5%. Chinese and Russian summer services grow, but carry under 1% of Asia–Europe container volume in 2030.
The Northwest Passage and the transpolar route
- The Northwest Passage through Canada stays marginal. In 2024 there were 38 complete transits, mostly yachts and cruise ships, and only 44 cargo ships made the crossing between 2019 and 2024. Narrow, ice-choked channels and a legal dispute between Canada and the US remain. Forecast: fewer than 30 commercial cargo transits a year in 2035 (90%). US Naval Institute; Belfer Center
- The transpolar route over the pole runs mostly through high seas, outside any country's zone. If it opens, it removes Russia's control, which is why China invests in polar research and icebreakers. Forecast: the first commercial cargo crossing of the central Arctic Ocean before 2040: 15%; before 2050: 40%.
Suez and the Cape: still the main roads
Suez is recovering from the Red Sea attacks. Revenue was a record $10.25 billion in 2023 and $3.99 billion in 2024; it reached $567 million in August 2026, up 57%, with transits up 27%. Container lines are returning only gradually. The Arctic takes a rounding error from this: in 2024 there were 13,213 Suez transits, and the NSR's busiest season will have about 150. Arab News; Mid-Trans
Oil and gas: where Arctic energy will flow
Crude: east by sea, under sanctions
- Vostok Oil is the biggest new flow. Rosneft targets 30 million tonnes a year from the second half of 2027 and 50 million by 2030. Critics note that the ice-class tanker fleet it needs, at least 40 ships, mostly does not exist yet. Forecast: Vostok Oil ships 30 million tonnes or more in 2028: 10%. Our central case for 2030 is about 12 million (80% range 4–25). The Moscow Times
- The shadow fleet moves north. Tankers carried 1.83 million tonnes of oil across the NSR in 2025, 4.2% less than in 2024. In 2026, Bellona saw more sanctioned "shadow" tankers on the route in two months than in all of 2025, and Windward tracked a convoy of eight of them. Some carry oil to China and others transfer cargoes near Nakhodka. Barents Observer; Bellona; Windward
- The pattern: in summer, Russian Arctic crude goes east via the NSR to China. In winter it goes west through Murmansk and around Europe on shadow tankers. The Hormuz crisis makes this oil more valuable to Asian buyers, and makes Western enforcement harder.
LNG: Yamal loses Europe, China becomes the only big buyer
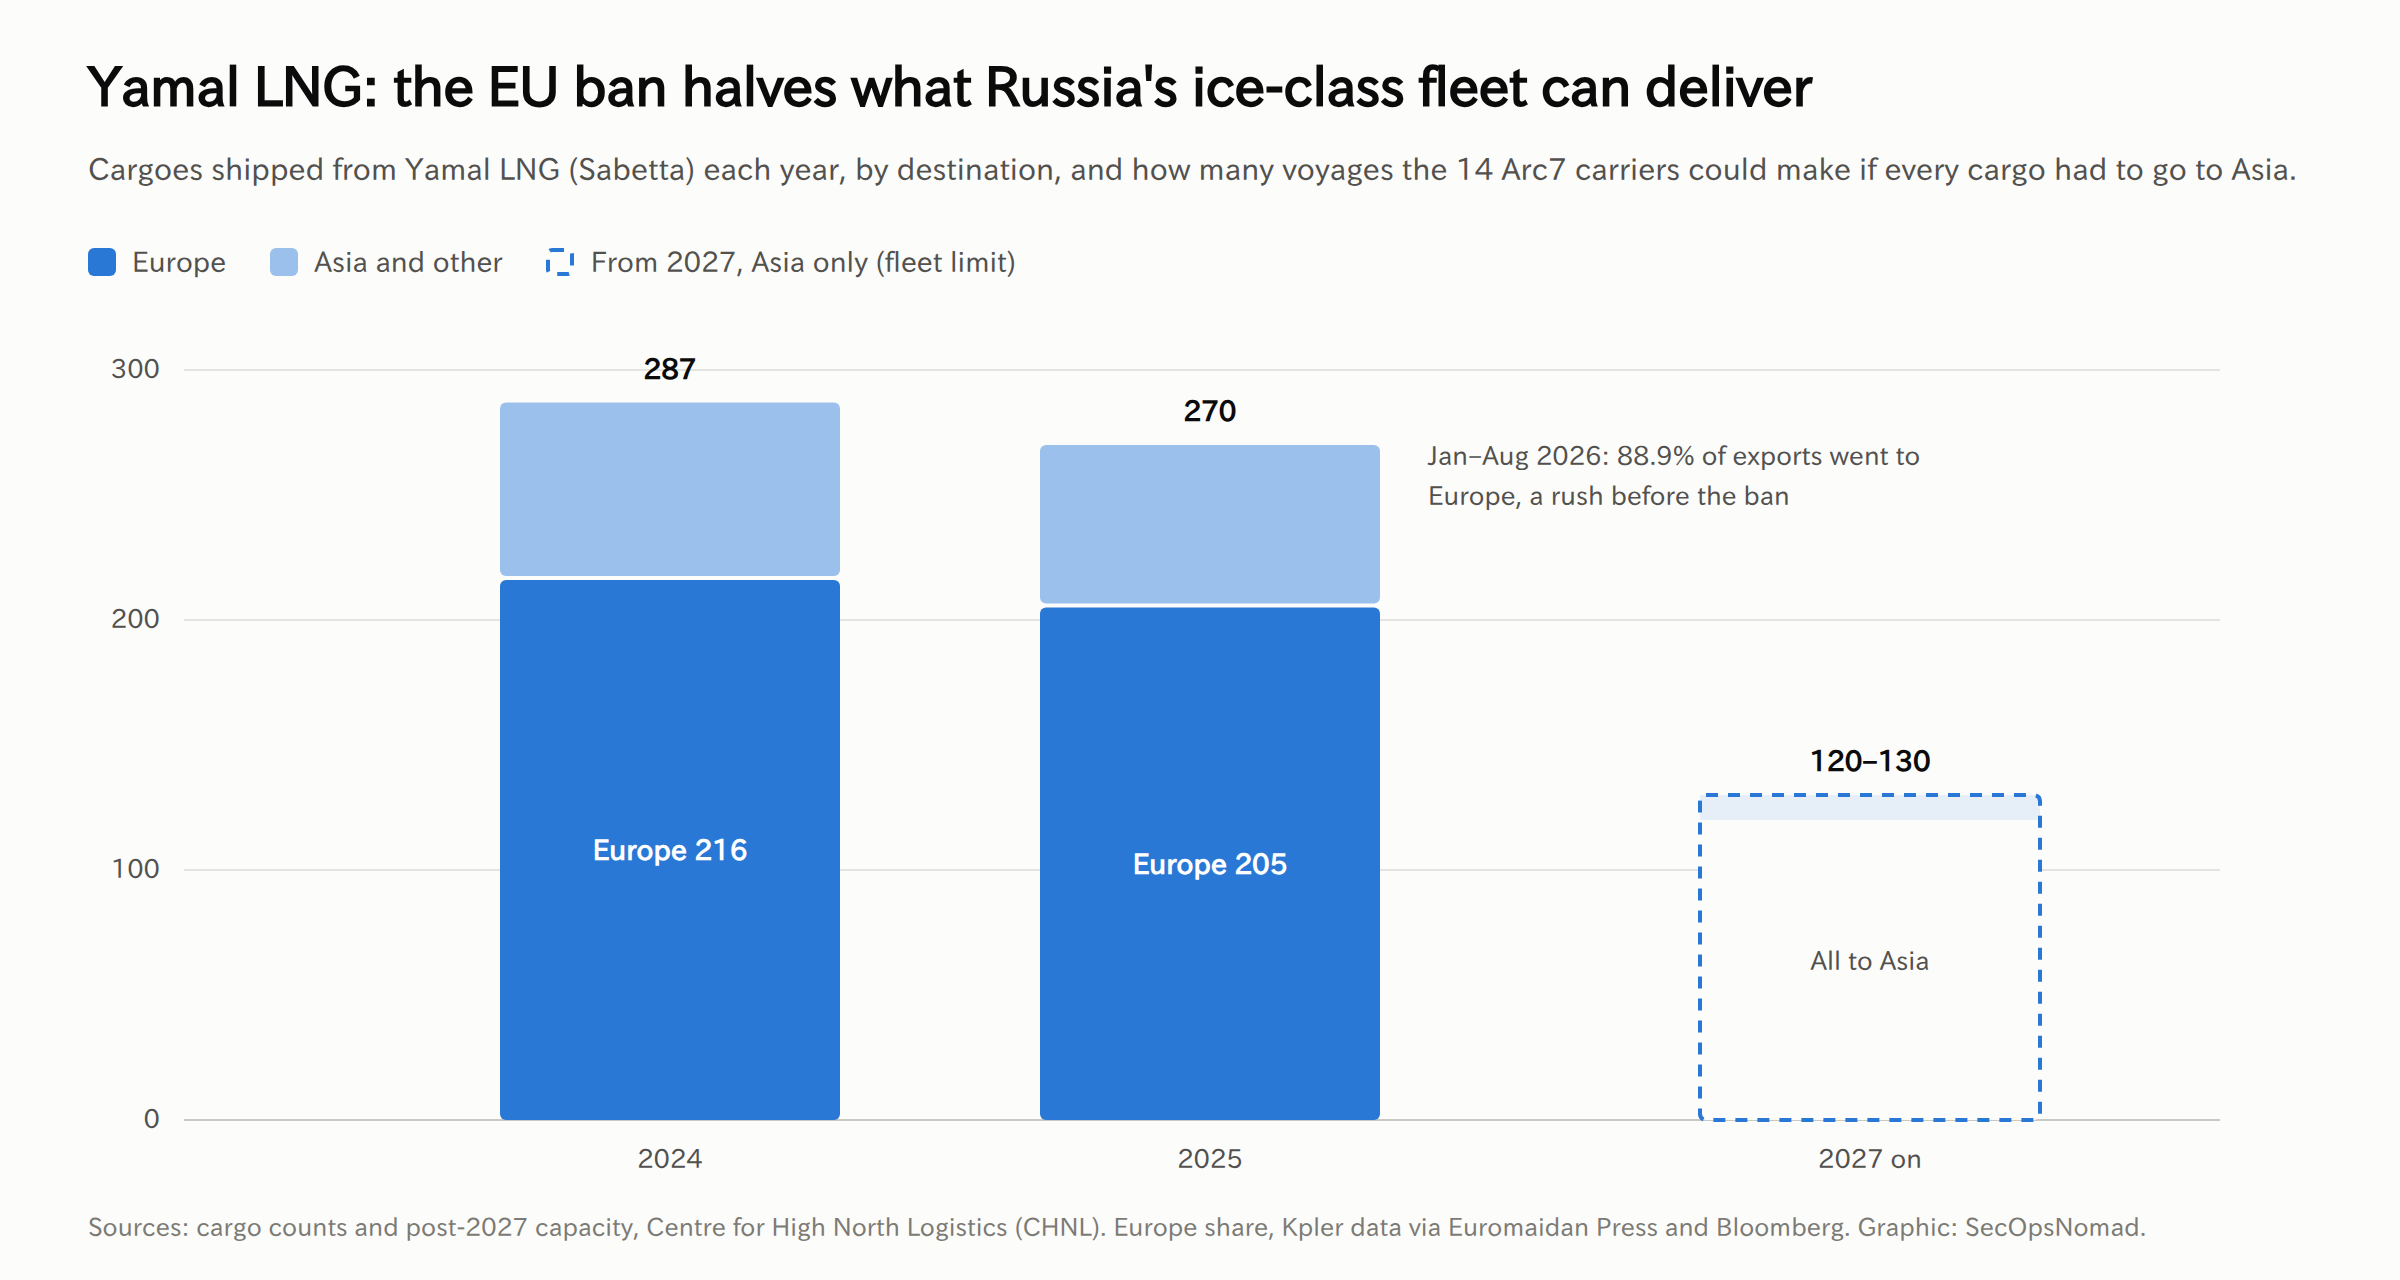
Yamal LNG is the Arctic's largest energy export. In 2025 it shipped 270 cargoes, and Europe took more than three-quarters of them; in January to August 2026 Europe's share rose to 88.9% as buyers rushed in before the ban. From 1 January 2027 Novatek must send almost everything to Asia. That is a longer voyage, and the eastbound NSR is closed in winter. CHNL estimates that its 14 Arc7 ice-class carriers could then make only about 120–130 voyages a year, less than half of recent volumes. CHNL; High North News; Euromaidan Press
- Arctic LNG 2 has no buyer except China's Beihai terminal. It shipped 23 cargoes (1.3 million tonnes) there in 2025, and reports citing Reuters count at least 31 cargoes (2.3 million tonnes) so far in 2026. China is reported to be preparing a second receiving terminal, at Longkou. The UK has sanctioned Beihai; the US and EU have not. Baird Maritime; FDD; OilPrice
- Will the EU blink? Traders say pressure to delay grows the longer Hormuz stays shut. The ban is written into EU law, though, and the Commission has ruled out reopening it. Forecast: the long-term ban takes effect on 1 January 2027 as planned: 80%. S&P Global
- Alaska LNG is the Western Arctic answer for Asia. It has preliminary offtake for 13 of the 16 million tonnes a year it needs, from buyers including JERA, Tokyo Gas, POSCO, CPC, PTT and TotalEnergies, and South Korea has announced a conditional investment of more than $50 billion. There is still no final investment decision; first pipeline gas is targeted for 2029. Forecast: a final investment decision by the end of 2027: 40%. Anchorage Daily News; EnergyNow
- Norway is the quiet winner. Its Johan Castberg field in the Barents Sea has produced up to 220,000 barrels a day since 2025, and Norway's gas and oil are what Europe can buy with neither Russian nor Gulf risk. Norwegian Offshore Directorate
The USGS still estimates that the Arctic holds about 13% of the world's undiscovered oil and 30% of its gas, most of it offshore and inside national zones. Price, sanctions and buyers decide how much of it is produced. Less ice changes the cost of shipping it, not who owns it. USGS
Who gains and who loses, to 2035
| Country | Shipping | Oil and gas | Security and leverage | Net, to 2035 | Confidence |
|---|---|---|---|---|---|
| China | A second, seasonal route to Europe that avoids Malacca, the Red Sea and Hormuz | Discounted Arctic oil and LNG, sole buyer of Arctic LNG 2 | More influence over Russia's Arctic | Gains | High |
| Norway | Little change | The reliable supplier that is neither in the Gulf nor Russian; Barents oil | Frontline exposure: GNSS jamming on 294 days in 2023 in Finnmark | Gains | High |
| United States | Little change | Gains if Alaska LNG is built | Larger footprint in Greenland; icebreaker gap with Russia | Gains | Medium |
| Russia | Fees and control on the NSR | More oil to China at a discount; Yamal LNG loses Europe | Growing dependence on China in its most sensitive region | Mixed | Medium |
| Japan | A seasonal second option to Europe | Alaska LNG offtake; 10% Arctic LNG 2 stake stranded by sanctions | Russia–China cooperation north of Japan | Mixed | Medium |
| South Korea | Busan as an Arctic gateway; ice-class shipbuilding | Alaska LNG investment, if it proceeds | Little change | Gains, if Alaska LNG proceeds | Low |
| Greenland and Denmark | Little change | Minerals, slowly | Leverage with Washington, but also pressure | Gains | Medium |
| Canada | The Northwest Passage stays marginal | Little change | Sovereignty dispute with the US; costly presence | Little change | Medium |
| Finland | Little change | Little change | Icebreaker design and building for the US and Canada | Gains | Medium |
| European Union | Minor port gains | Gives up Russian LNG and pays more | Less dependence on Russia | Mixed | Medium |
| Egypt | Arctic traffic is under 1% of Suez; Red Sea security matters far more | Little change | Little change | Little change from the Arctic | High |
Four scenarios to 2035
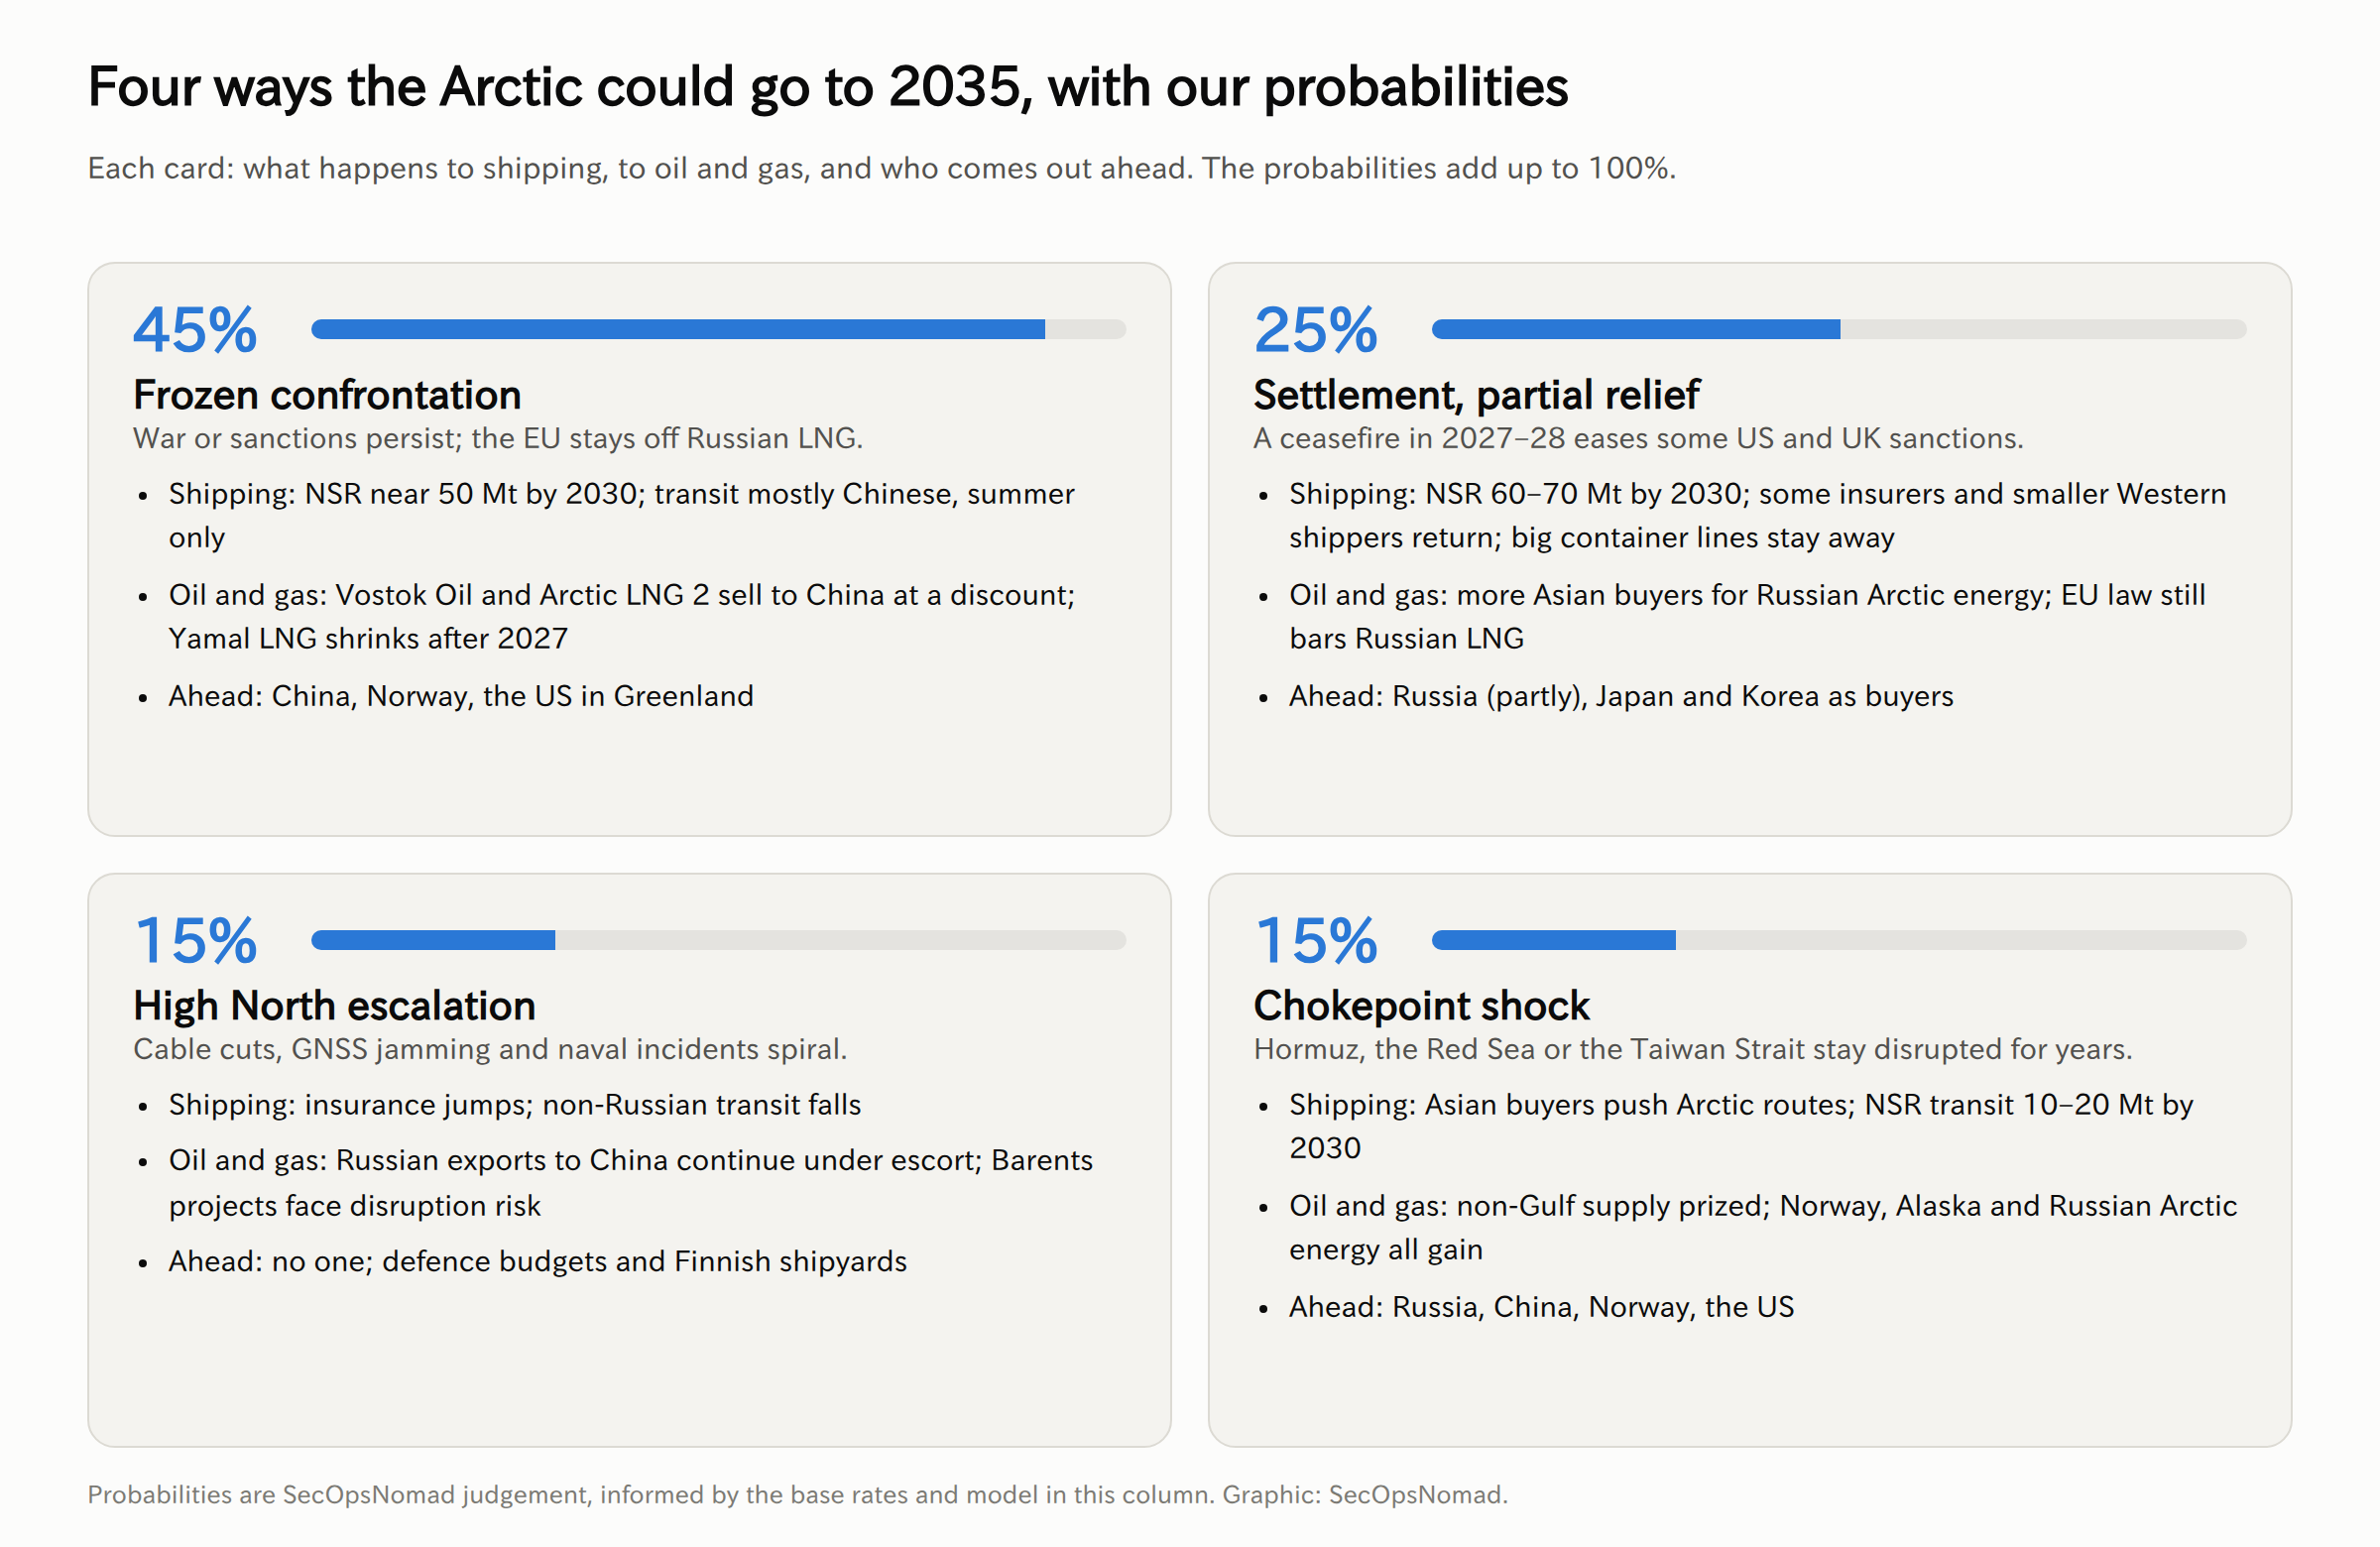
Our central case is the first: a frozen confrontation in which the Arctic splits into a Russian–Chinese energy corridor and a NATO security zone. What would move us:
- A real ceasefire with sanctions relief moves weight to the second scenario. Expect more Asian buyers and some Western insurers, but EU law still keeps Russian LNG out.
- More cable cuts, jamming or a naval incident in the Barents Sea or near Svalbard moves weight to the third.
- Hormuz still closed in mid-2027, or a crisis in the Taiwan Strait, moves weight to the fourth. In that case even Western shippers may quietly accept Arctic cargoes.
Forecasts we will score
| # | Forecast | Probability | Resolves | How to check |
|---|---|---|---|---|
| 1 | The EU ban on Russian LNG under long-term contracts takes effect on 1 January 2027, without delay | 80% | January 2027 | Official Journal of the EU; Commission |
| 2 | Yamal LNG ships fewer than 200 cargoes in 2027 (270 in 2025) | 70% | Early 2028 | CHNL annual count |
| 3 | Total NSR cargo in 2027 is below 2025's 37.0 million tonnes | 35% | Early 2028 | Rosatom figures, via CHNL |
| 4 | Vostok Oil ships 30 million tonnes or more in 2028 | 10% | Early 2029 | Rosneft; CHNL |
| 5 | Total NSR cargo in 2030 reaches 70 million tonnes (our median is 50) | 10% | Early 2031 | Rosatom figures, via CHNL |
| 6 | Maersk, MSC, CMA CGM or Hapag-Lloyd announces a scheduled NSR service before 2030 | 5% | 2030 | Carrier announcements |
| 7 | NSR transits stay below 3% of Suez transits in 2035 | 90% | 2036 | CHNL; Suez Canal Authority |
| 8 | Both the Danish and Greenlandic parliaments approve the Greenland agreement by the end of 2027 | 75% | December 2027 | Folketing; Inatsisartut |
| 9 | Alaska LNG takes a final investment decision by the end of 2027 | 40% | December 2027 | Company announcement |
| 10 | The US imposes secondary sanctions on a Chinese buyer of Arctic LNG 2 cargoes by the end of 2027 | 25% | December 2027 | OFAC sanctions list |
| 11 | September Arctic sea ice averages below 1 million km² in at least one year before 2035 (before 2050: 70%) | 10% | 2035 | NSIDC Sea Ice Index |
| 12 | A commercial cargo ship crosses the central Arctic Ocean, mostly outside any country's zone, before 2040 | 15% | 2040 | CHNL; ship-tracking data |
We will revisit these each year after the September ice minimum and the end of the NSR season, and score them when they resolve.
Signposts to watch
| Signpost | Where to find it | Moves forecasts |
|---|---|---|
| September sea-ice minimum | NSIDC, each September | 11, 12 |
| NSR cargo and transit voyages | CHNL and Rosatom, each winter | 2–7 |
| EU and US sanctions on Russian LNG, oil and their buyers | EU Official Journal, OFAC, UK and Japanese lists | 1, 2, 10 |
| Strait of Hormuz flows and Qatari LNG | IEA Oil Market Report, QatarEnergy | 1, scenario 4 |
| Vostok Oil tanker deliveries | Rosneft, shipyards, ship tracking | 4, 5 |
| Greenland ratification | Folketing (vote 19 November 2026), Inatsisartut | 8 |
| Alaska LNG financing | Glenfarne, the Alaska Legislature, Korean and Japanese buyers | 9 |
| Icebreaker deliveries | Rosatom, US Coast Guard, Finnish yards | 3–7 |
| Cable damage and GNSS jamming | Norwegian authorities, NATO | Scenario 3 |
The security dimension: the attacker's playbook
The Arctic has very little infrastructure, so each piece matters. A cable, a ground station or a navigation signal often has no backup. As traffic and energy flows grow, so does the value of pressure that stays below the threshold of an armed attack.
- Cutting or damaging undersea cables. In January 2022, one of the two cables connecting Svalbard to mainland Norway was damaged; a Russian fishing vessel had crossed it many times, but no link has been proven. Those cables serve SvalSat, a major ground station for polar-orbiting satellites. FDD
- Jamming satellite navigation. In Finnmark, on Norway's border with Russia, GPS interference was recorded on 294 days in 2023, 48 times more than in 2019. High North News; Barents Observer
- Spoofing positions. Faking a ship's satellite position or its AIS identification signal hides sanctioned shadow tankers and the ship-to-ship transfers that keep Arctic oil moving. In industrial control terms this resembles ATT&CK for ICS Spoof Reporting Message (T0856) and Loss of View (T0829).
- Cyberattacks on Arctic operators. Ports, LNG plants, icebreaker operators and shipping companies are targets for espionage and pressure, through phishing (T1566), exploited public-facing systems (T1190) and compromised suppliers (T1195).
- Exploiting sanctions gaps. Shell companies, reflagged ships and transfers at sea let sanctioned Arctic energy reach buyers. For anyone in the chain, that is a legal risk as well as a security one.
The security dimension: the defender's playbook
- Map your Arctic dependencies (Third-party Risk, IT Operations). Which suppliers ship via the NSR or own ships that do? Which satellite, weather or Earth-observation services depend on Arctic ground stations? Which systems take their time from GNSS?
- Treat navigation and time signals as untrusted inputs (IT Operations, OT). Use several time sources with holdover clocks. Alert on time offset jumps and loss of GNSS lock, and flag impossible position jumps and long AIS gaps in fleet or logistics tracking.
- Plan for losing a link (IT Operations). Test what happens if data passing through Arctic cables or ground stations is delayed for a week, and put recovery times and alternative routes in contracts.
- Screen for sanctions exposure (Legal / Privacy, Third-party Risk). Include Arctic LNG and oil projects, NSR operators, reflagged tankers and receiving terminals such as Beihai in screening. Check that your logistics do not contradict commitments not to use the NSR.
- Brief leadership on forecasts, not headlines (all teams). Put the Arctic on the same risk register as Hormuz, the Red Sea and the Taiwan Strait, and tie each review to the signposts above.
Japan's angle
- Energy security. In 2025, 2.22 million of Japan's 2.36 million barrels a day of crude imports came from the Middle East, about 94%. The Hormuz crisis forced reserve releases in 2026. Arctic and North Pacific supply, from Alaska LNG to Sakhalin, now matters more. JERA and Tokyo Gas have preliminary Alaska LNG deals. Argus; World Oil
- A stranded stake. Japan Arctic LNG, owned by JOGMEC and Mitsui, holds 10% of Arctic LNG 2, which only China now buys from. Sanctions decisions on Russian Arctic energy directly affect Japanese companies.
- Shipping. A summer route to Europe that avoids Suez and the Red Sea is a useful option for some cargo. It is no replacement for year-round routes, and using it means relying on Russian permits.
- Science and security. JAMSTEC's research icebreaker Mirai II is due on 18 December 2026, with voyages near the North Pole in 2027–28 and a trans-Arctic voyage in 2029. Russia–China cooperation in the Arctic reaches into the waters north of Japan. Japan Times
How these forecasts could be wrong
- The ice. Year-to-year variation is large; a very warm or very cold run of years shifts the near-term numbers.
- The data. Most NSR cargo and transit figures come from Russian state sources or from analysts who rely on them, and 2026 counts are provisional.
- The war and sanctions. A settlement, or a decision by Washington on Chinese buyers, could change Russia's outlook within months.
- Hormuz. We do not forecast the Gulf crisis itself; a quick reopening weakens the case for Arctic energy, while a long closure strengthens it.
- The model. Its inputs are ranges, not quotes. Our ranges for hire rates, Arctic fees and insurance are judgements, and the model leaves out port calls on the southern routes. We publish it so that you can change them.
Data and code
- The voyage-cost model (Python, standard library only). Run
python3 arctic-route-economics.py; it takes a few seconds and writes the results file below. - Its output (JSON). Every model number in this column comes from this file, and the fixed seed makes it identical on every run.
Sources
- National Snow and Ice Data Center: 2026 Arctic sea ice minimum and September extent data, G02135 v4.0; NASA: Arctic sea ice minimum extent
- Rantanen et al. (2022): The Arctic has warmed nearly four times faster than the globe; IPCC AR6 WGI: Summary for Policymakers; Kim et al. (2023): An ice-free Arctic even under a low emission scenario
- Smith & Stephenson (2013): New trans-Arctic shipping routes navigable by midcentury; Melia, Haines & Hawkins (2016): Sea ice decline and 21st century trans-Arctic shipping routes
- IEA: Oil Market Report, October 2026; Al Jazeera: QatarEnergy halts LNG production; The National: Qatar extends LNG force majeure
- European Commission: REPowerEU and the phase-out of Russian energy; High North News: no reversal on the Russian LNG ban; S&P Global: market not pricing the full ban; urgewald: record EU imports of Russian Arctic LNG
- Centre for High North Logistics: NSR transits as of 30 September 2026; Yamal LNG export dynamics and post-2027 capabilities; NSR transit in 2025; Container News: explainer on the 2026 record
- Interfax: NSR development plan to 2035 and Rosatom on icebreaker tariffs; TASS: Rosatom's 150 million tonnes by 2035 and the icebreaker cost model; gCaptain: the 2024 record and the 80 million tonne target; Rosatom: trans-Arctic corridor model; High North News: 270 million tonnes by 2035; Inland Ocean: NSR statistics
- Shin & Kim (2026): Probabilistic threshold conditions for NSR cost competitiveness; Port Economics, Management and Policy: routing options between Shanghai and Rotterdam; Arctic Council: Arctic Marine Shipping Assessment 2009; Novatek: first Yamal LNG cargoes to China via the NSR
- S&P Global: Vostok Oil first loading; Baird Maritime: Vostok Oil cargo lands in China and Arctic LNG 2 cargoes to China; The Moscow Times: Vostok Oil's promises; FDD: China and Russia's Arctic energy; OilPrice: Arctic LNG and China
- High North News: Yamal LNG deliveries could drop 50%; Euromaidan Press: why the EU still buys Russian LNG
- Barents Observer: shadow ships on the NSR; Bellona: shadow tankers in summer–autumn 2026; Windward: a Russian convoy on the Arctic route
- Rosatom Newsletter: regular NSR transit, September 2026; Interfax: NewNew Shipping's 2026 voyages; World Nuclear News: first container ship to the UK via the NSR
- US Naval Institute: Northwest Passage transit realities; Belfer Center: Northwest Passage explainer
- Arab News: Suez Canal revenue in 2024; Mid-Trans: Suez traffic and revenue in August 2026
- Anchorage Daily News: Alaska LNG as a federal project; EnergyNow: Alaska LNG offtake before FID; World Oil: JERA's Alaska LNG offtake
- Norwegian Offshore Directorate: Johan Castberg field; US Geological Survey: Circum-Arctic Resource Appraisal
- Copenhagen Post: Danish debate on the Greenland agreement; Reuters: US, Denmark and Greenland sign deal; Al Jazeera: three-way peace talks; CFR: War in Ukraine tracker
- FDD: Arctic undersea cables and space; High North News: GPS disruption in Finnmark; Barents Observer: Norway boosts GPS jamming detection
- Argus: Japan's oil supply and reserves; The Japan Times: Japan's new Arctic research vessel
Update history.
- 28 October 2026. Rewritten as a forecast: dated predictions with probabilities, a base rate from Russia's targets, a downloadable voyage-cost model, oil and LNG flows after the EU ban and the Hormuz crisis, a scorecard of countries and four scenarios. New figures replace the earlier impacts, cargo and outlook charts. CHNL's, High North News's and several news pages could not be opened from our environment; their figures come from search results quoting them, each checked against a second report.
- 7 October 2026. First published.
Sources checked on 28 October 2026 (JST). Charts and maps were produced by SecOpsNomad from the data cited; route lines are schematic. Forecasts are SecOpsNomad's judgement, not investment advice.