A reader asked us for a source that explains how the recent breaches are being done, with a timeline. What they had found was mostly opinion: no details, not even reasoned hypotheses. They want to combine financial-services quantitative risk management with supply-chain risk. There is no single source that does this. The answer is a method: start from primary documents, grade each claim by who made it and on what evidence, put dates on everything, and only then fit a model. This article does that for Japan, where we have tracked every breach notice since August, and publishes the data and code so the numbers can be checked.
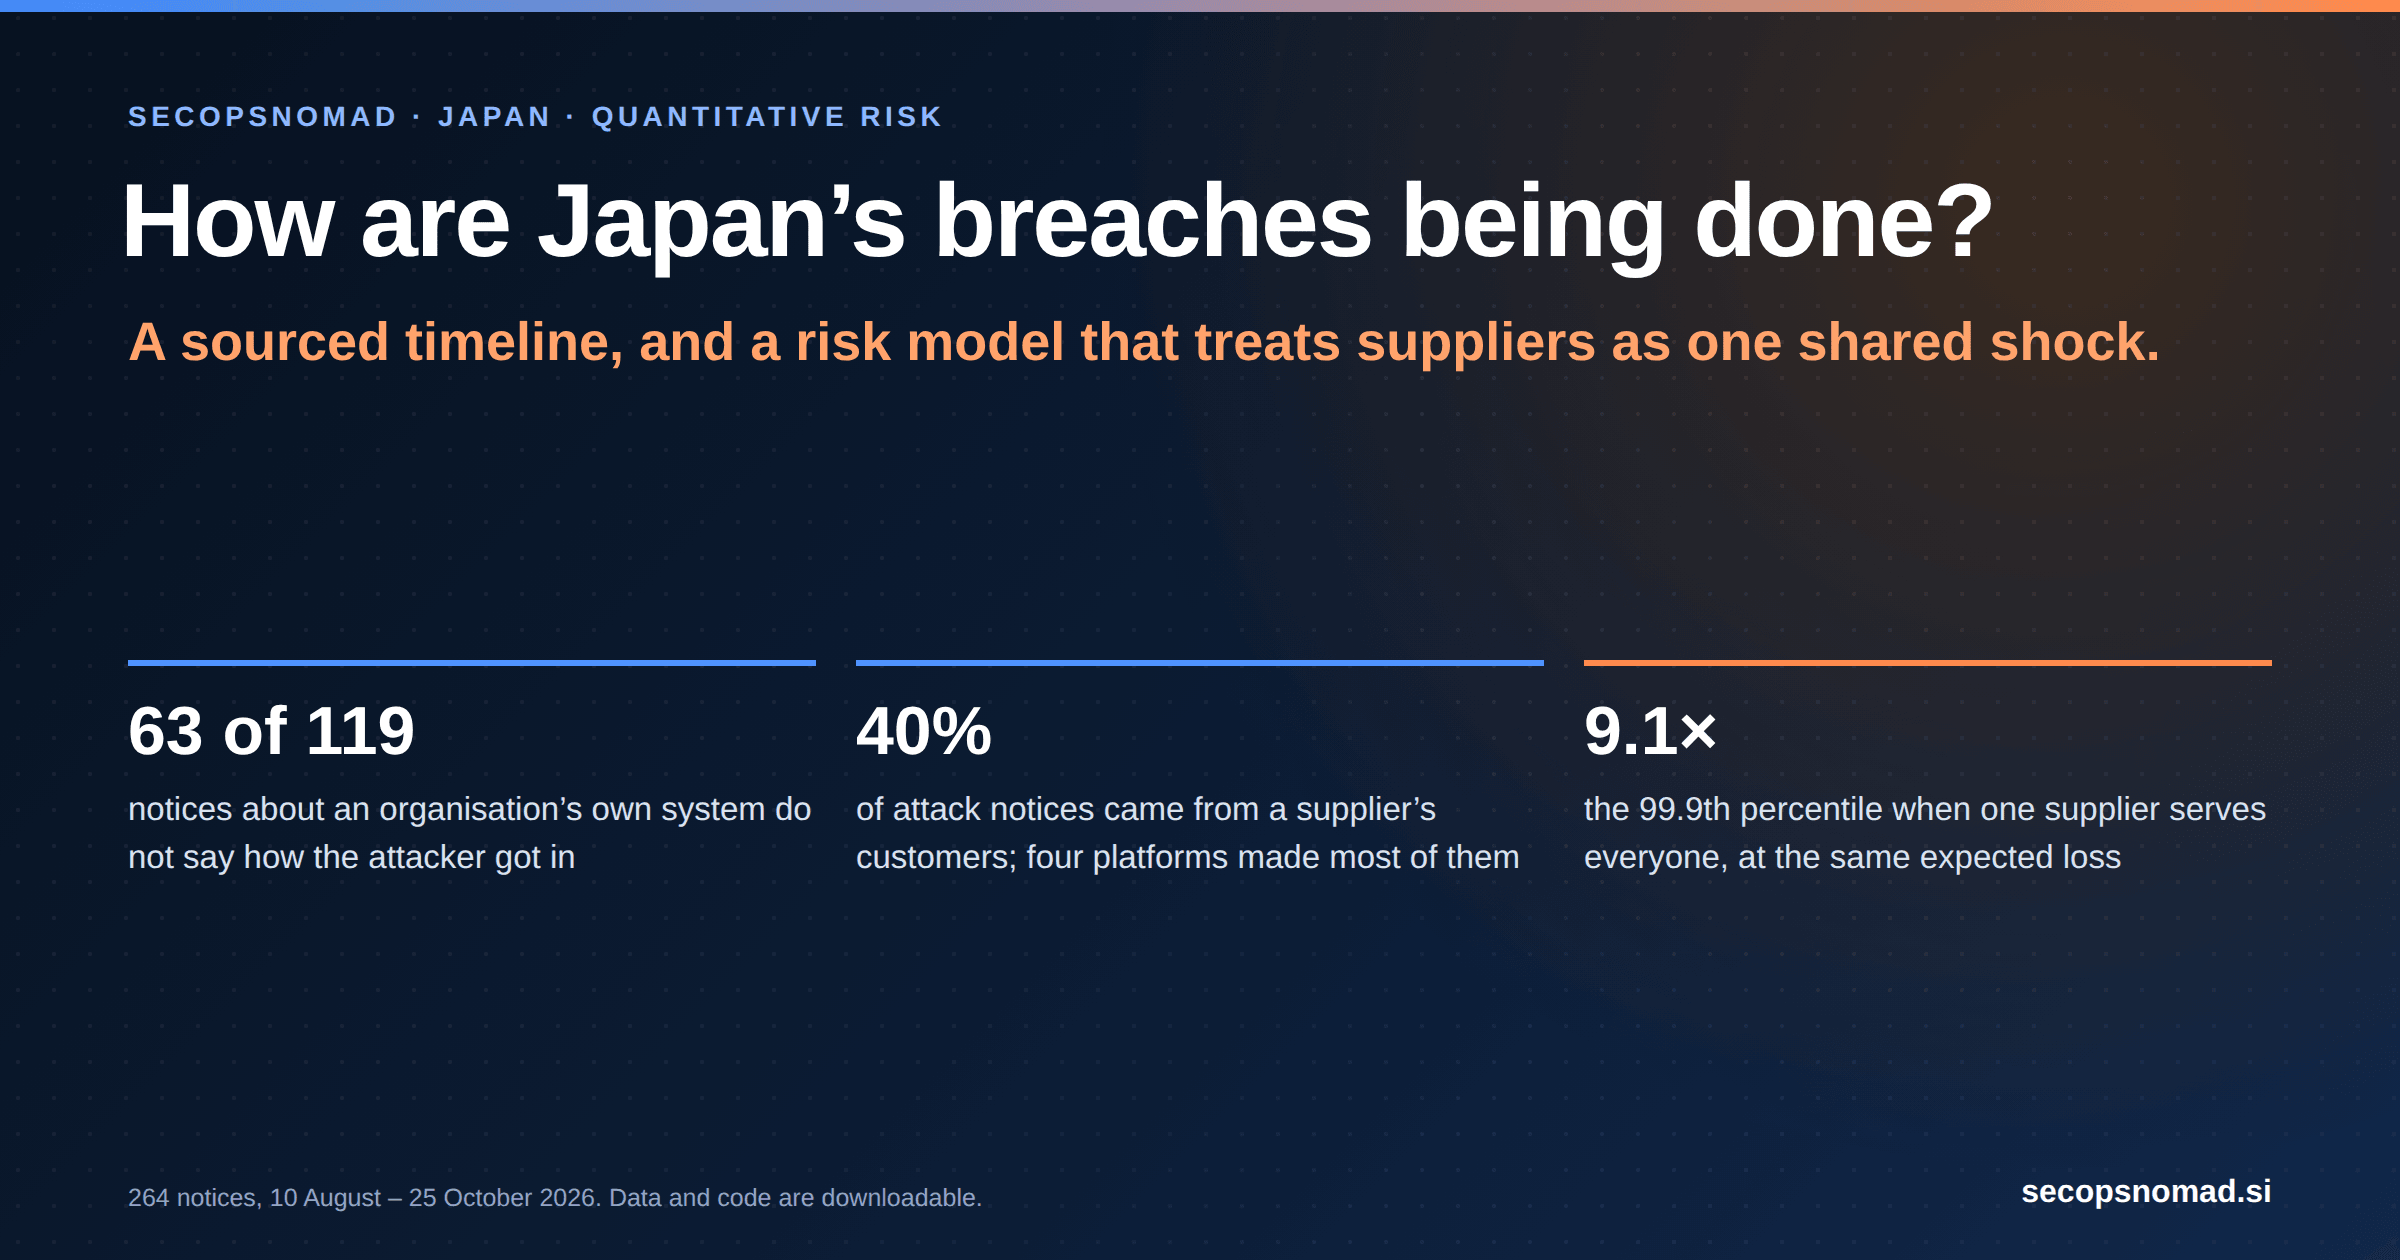
Four findings carry the rest:
- Most notices do not say how the attacker got in. Of 119 attack notices about an organisation's own system between 10 August and 25 October 2026, 63 give no route. What we know about technique comes mainly from responders, not victims.
- Four in ten attack notices are a supplier's breach, reported by its customers. 79 of 198 came from customers of 19 suppliers. Four platforms account for 77% of them, and their customers publish in bursts, on the same days.
- The size of a breach has no usable average. Above 100,000, reported figures follow a power law with a tail index of about 0.38, bending only among the very largest notices. Below 1, the mean is set by the largest event you allow, not by the data.
- Supplier concentration changes the tail without changing the mean. In a portfolio of 1,000 firms with the same expected number of incidents, putting everyone on one supplier raises the 99.9th percentile from 61 firm-level incident impacts to 558.
Updated 25 October 2026, 16:15 JST. The dataset now covers 264 notices from 10 August to 25 October, analysed as one set, and every figure and table below was recomputed on it. The update history at the end lists what changed.
Where to look, and what each source can tell you
Use news reports to find the documents, not as the source. Each kind of primary document answers part of the question, and each has a blind spot.
| Source | What it gives you | What it cannot give you | This autumn |
|---|---|---|---|
| The organisation's own notice and its follow-ups | Route (sometimes), access and discovery dates, data types, counts | Anything the company chose not to say; the first count is an estimate | 264 notices in 11 weeks, in our CSV; our breach review has many of them in tables |
| Exchange filings | Material impact on a listed company, on a deadline | Technique; small or unlisted companies | Daiwa Securities' TDnet filing; in the US, Form 8-K Item 1.05, due four business days after a company decides an incident is material |
| CERT alerts | Techniques seen across cases, indicators, observation periods | Victim names; whether a technique caused any particular breach | JPCERT/CC AT-2026-0030, Cases A to E |
| Incident-response firms | Behaviour seen inside investigations, sometimes infrastructure | A view beyond their own clients | Macnica, CrowdStrike |
| Government and regulators | Scale, policy, what organisations must report and when | Technique detail | NICT, the National Cybersecurity Office, the Personal Information Protection Commission |
| Breach datasets | Rates and patterns across many incidents | Neutral coding: someone chose the categories | Verizon's DBIR and its open VERIS Community Database; our CSV below |
Outside Japan, the same structure holds. Verizon's 2026 DBIR, as summarised by Help Net Security, puts exploitation of vulnerabilities at 31% of initial access, ahead of stolen credentials for the first time. We could not open the report itself, so treat that figure as reported.
Timeline, July to 25 October 2026
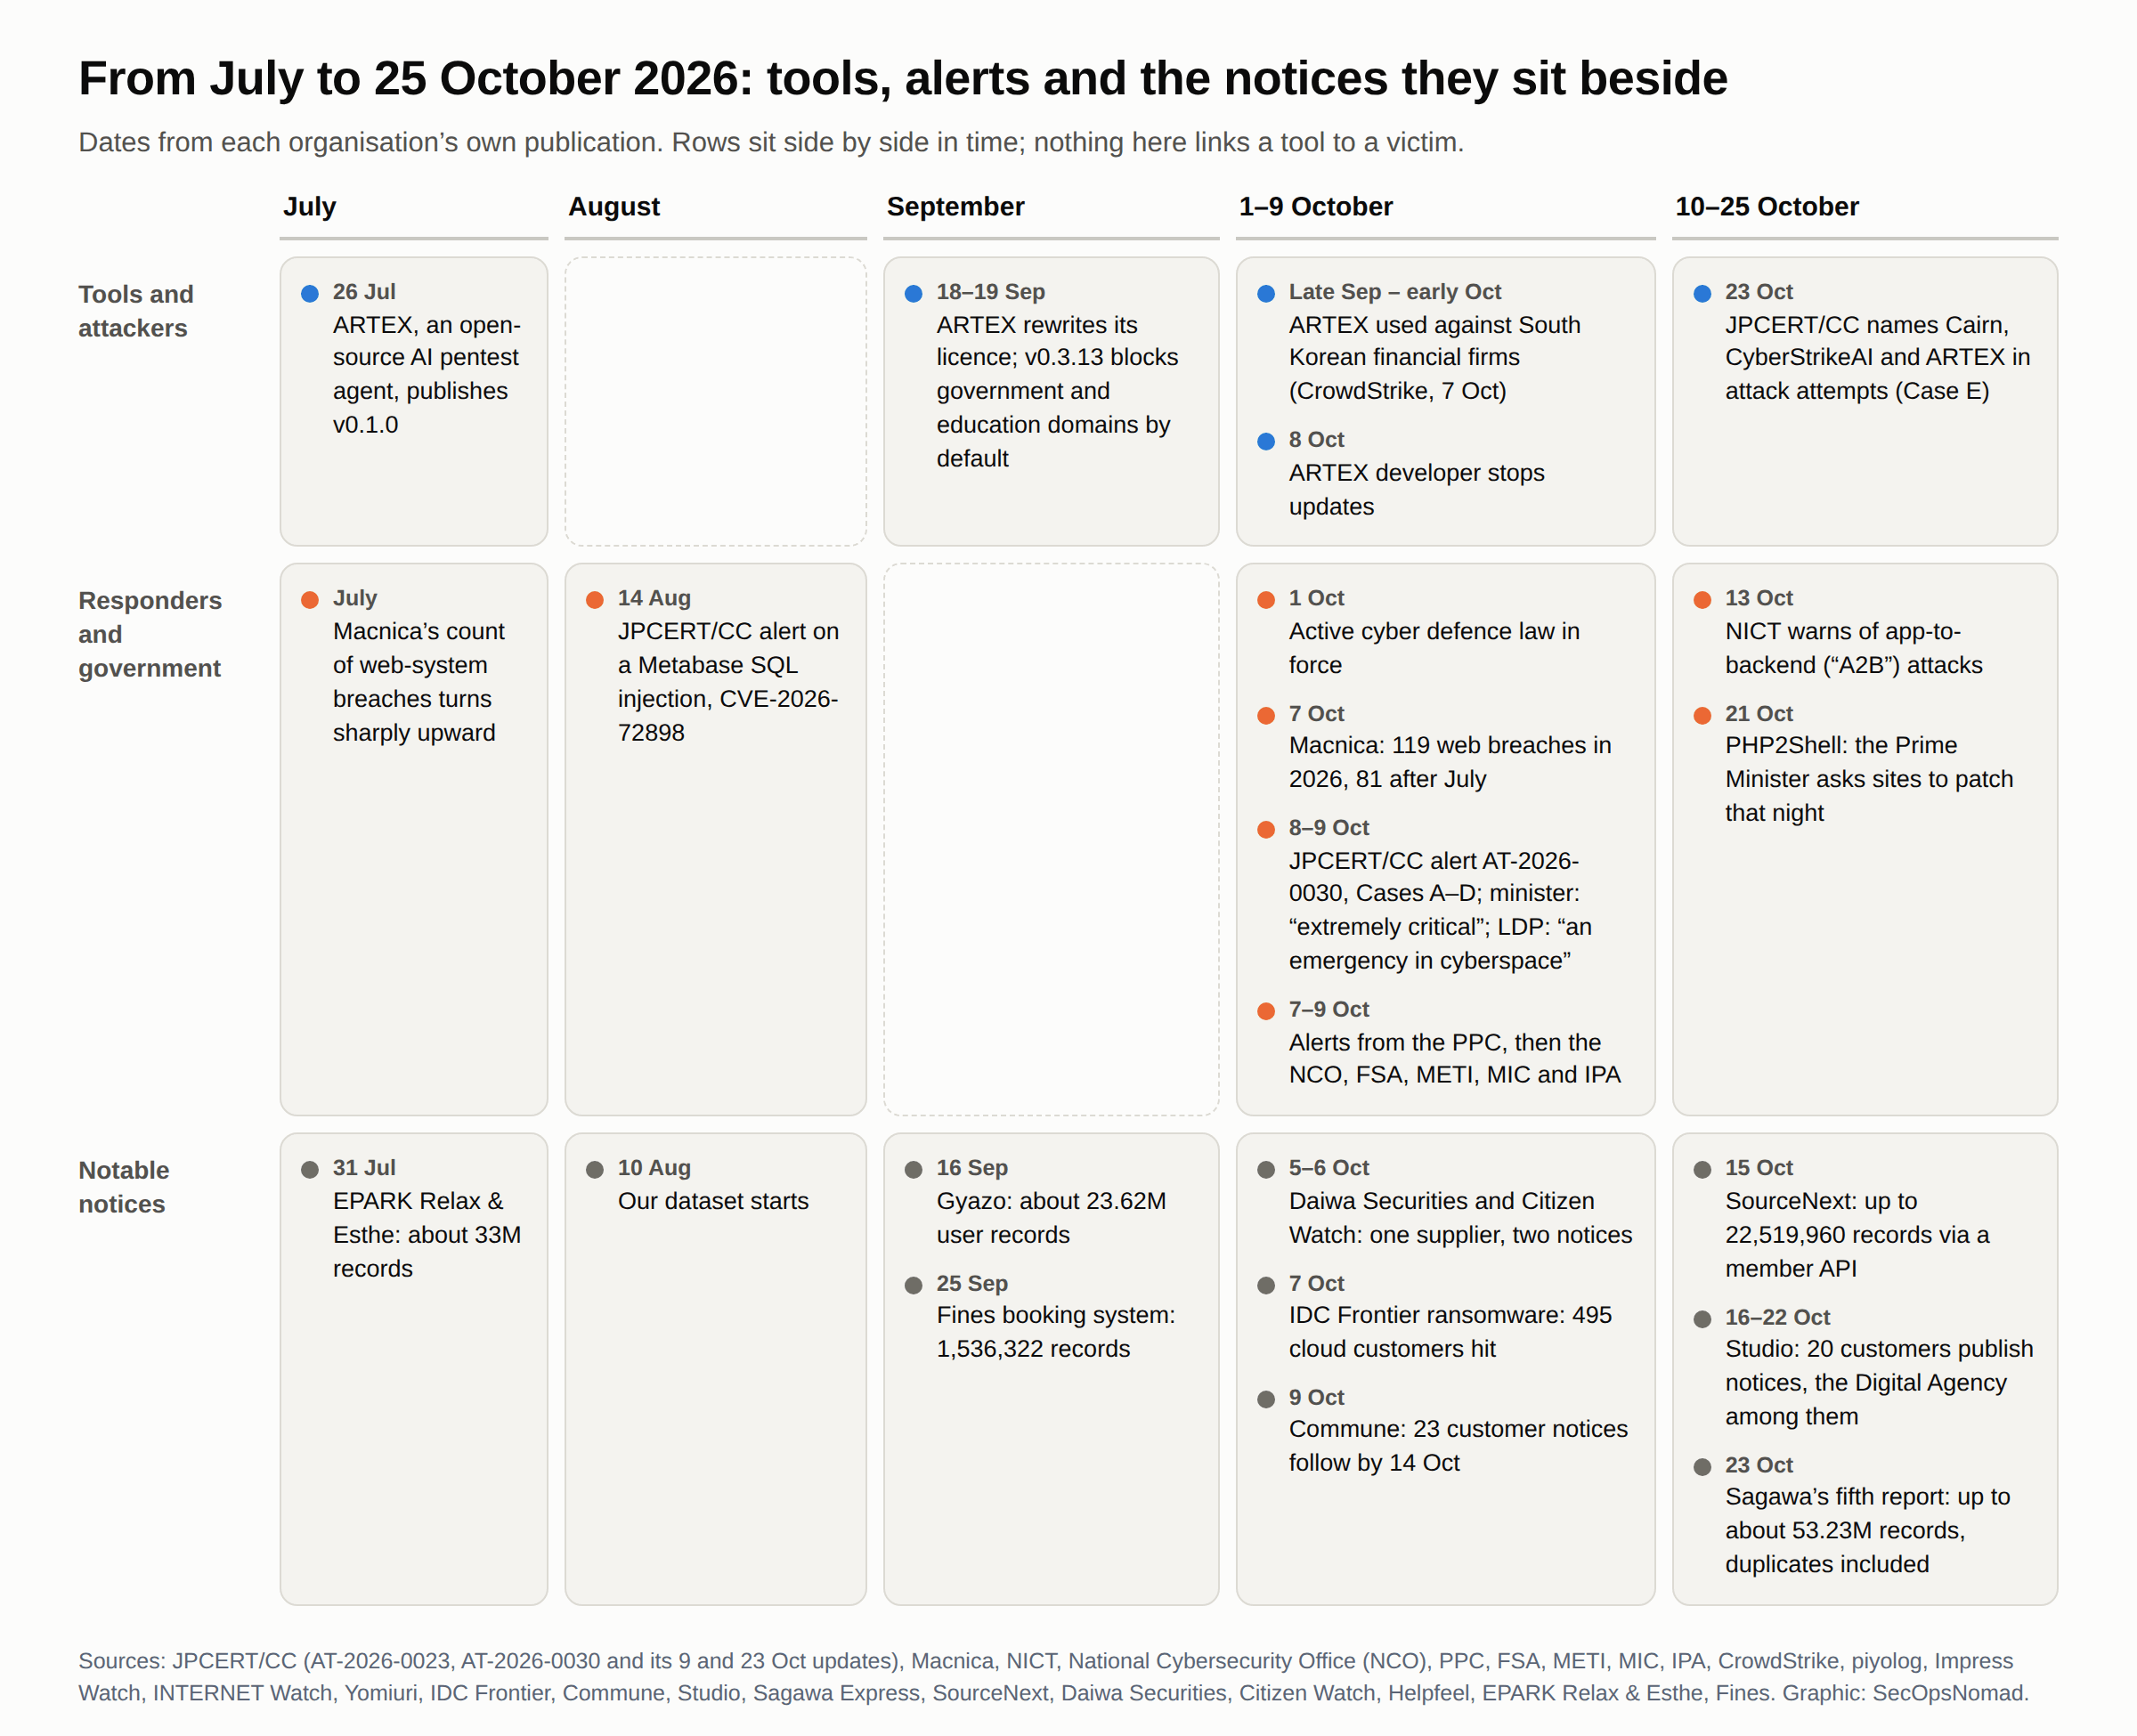
Figure 1. What happened when, from each organisation's own publication. Rows sit side by side in time; nothing in the figure links a tool to a victim. Original graphic for this article.
| Date (2026) | Event | Evidence type | Source |
|---|---|---|---|
| July | Macnica's count of web-system breaches turns sharply upward; 81 of 119 in the year come after July | Responder count | Macnica |
| 26 Jul | ARTEX, an open-source AI penetration-testing agent, publishes v0.1.0 | Tool history | piyolog |
| 31 Jul | EPARK Relax & Esthe: about 33 million records on a salon booking platform | Victim notice | EPARK Relax & Esthe |
| 14 Aug | JPCERT/CC alert on a SQL injection in Metabase, CVE-2026-72898 | CERT alert | JPCERT/CC |
| 15 Sep | LEAN BODY names Metabase as its route; access from 11 August | Victim notice | LEAN BODY |
| 16 Sep | Gyazo: a flaw in the image upload server let an attacker run commands; about 23.62 million user records | Victim notice | Helpfeel |
| 18–19 Sep | ARTEX rewrites its licence; v0.3.13 blocks government and education domains by default | Tool history | piyolog |
| Late Sep – early Oct | An unknown actor uses ARTEX with language models against South Korean financial firms | Responder report (7 Oct) | CrowdStrike |
| 1 Oct | Japan's active cyber defence law comes into force | Government | National Cybersecurity Office (PDF) |
| 5–6 Oct | Daiwa Securities and Citizen Watch report data held by the same enquiry-service supplier | Victim notices | Daiwa (TDnet) · Citizen |
| 7 Oct | IDC Frontier: ransomware takes down IDCF Cloud from 03:40; 495 customers affected | Victim notice | IDC Frontier · our analysis |
| 7 Oct | The Personal Information Protection Commission warns organisations holding large amounts of personal data: it previews stricter technical safeguards (phishing-resistant MFA, log analysis, EDR) and adds API abuse to its list of typical leak cases | Regulator | PPC · ScanNetSecurity |
| 8 Oct | JPCERT/CC alert AT-2026-0030 with Cases A to C; the cyber security minister calls the situation “extremely critical” | CERT alert; government | JPCERT/CC · Impress Watch |
| 9 Oct | Case D added; National Cybersecurity Office alert on web systems, supply chains and data; LDP's cyber chief: “an emergency in cyberspace” | CERT alert; government; party | INTERNET Watch · Yomiuri via Yahoo! Japan |
| 9 Oct | The FSA asks financial institutions to check third-party risk management and incident response, and to look harder at ID-document images in online identity checks | Regulator | FSA |
| 9–14 Oct | Commune: a flaw exposed community invite links and the attacker posed as admins; 23 customer organisations publish their own notices | Victim notices | Commune · Asahi Shimbun |
| 13 Oct | NICT warns of “A2B” attacks that analyse an app to reach its servers | Government research body | NICT |
| 15 Oct | SourceNext: a member-information API misused from 9 to 13 October; up to 22,519,960 records | Victim notice | SourceNext |
| 16–22 Oct | Studio: customers' form data reachable on 30 September and 1 October; 20 customers publish notices, including the Digital Agency (13,323 form entries) | Victim notices | Studio · Digital Agency · ITmedia NEWS |
| 21 Oct | PHP2Shell: the Prime Minister asks site owners to patch PHP that night | Government | Takaichi on X · our analysis |
| 22 Oct | Capcom: 11,774,247 CAPCOM ID accounts | Victim notice | Capcom · INTERNET Watch |
| 23 Oct | Sagawa Express's fifth report: up to about 53.23 million records, duplicates included; waybill data from 21 June to 30 September, customer lists and members; no card data or passwords | Victim notice, via reports | INTERNET Watch · Impress Watch |
| 23 Oct | FutureShop: a flaw in its e-commerce platform; 3,147,469 records of one shop's members (Lindt Japan) | Victim notices | FutureShop · Lindt Japan |
| 23 Oct | JPCERT/CC adds Case E, naming Cairn, CyberStrikeAI and ARTEX in attack attempts | CERT alert | JPCERT/CC · our ARTEX analysis |
Publication date is not attack date. LEAN BODY's access began on 11 August and was announced on 15 September; E-Store's intrusion ran from 21 May to 1 August. For a frequency model, decide which clock you are counting: the date of the attack, of discovery, or of disclosure. Public data gives you mostly the last; the lags between them are measured in the model section below.
How the breaches are being done, graded by evidence
Three levels, kept apart:
- Stated by the victim. The notice names the route. This is direct evidence for that incident, but only 56 of the 119 notices about an organisation's own system give one.
- Described by responders across cases. JPCERT/CC, Macnica and NICT describe techniques seen in several incidents without naming victims. This tells you what is happening, not which incident it explains.
- Hypothesis. A pattern that fits but has not been confirmed: for example, that AI penetration-testing agents are behind some of the per-site exploration. JPCERT/CC now names such tools in attack attempts; no named victim has been linked to one.
| Route | Own-system notices that state it (of 119) | Supplier incidents (of 19) | What responders describe | ATT&CK |
|---|---|---|---|---|
| Vulnerability or misconfiguration in an internet-facing system | 20 | 7 | Case A: each target scanned for many known flaws and for configuration and backup files. Case C: Metabase SQL injection. Case D: a web shell placed on an application server reachable from the public web server | T1595.002, T1190, T1505.003 |
| Stolen or misused account, phishing | 12 | 1 | From the notices: phished mail and Microsoft 365 accounts, a leaked token, credential stuffing (Fancrew: 5,060,270 login attempts in five days) and stolen admin passwords (Rakuten Drive) | T1078, T1566, T1110.004 |
| Ransomware or malware | 10 | 4 | Treated by JPCERT/CC as a separate, steady threat; IDC Frontier shows it at a provider | T1486 |
| App, API or web function abused | 13 | 1 | Case B: public apps analysed to find API endpoints and keys; internal APIs called that the app never uses; blind NoSQL injection; Tor and residential proxies; a User-Agent identical to the real app. Macnica's per-site trial and error; NICT's A2B | T1190, T1090.003 |
| Tech-support scam | 1 | 0 | From the notices: staff who believed a fake warning on screen | — |
| Not disclosed | 63 | 6 | — | — |
| Supplier or platform (cuts across the routes above) | — | 19, behind 79 customer notices | The National Cybersecurity Office's 9 October alert names supply chains as one of three areas | T1199 |
| AI penetration-testing platforms | No victim notice says so | — | Case E: Cairn, CyberStrikeAI and ARTEX in attack attempts, alongside WSUS servers and configuration files | T1588.002 |
A platform's own notice counts under its own system; its customers' notices count once, under the supplier incident they name.
Case D's wording comes from secondary summaries of the 9 October update (issoh); we could not open JPCERT/CC's page from our environment on 25 October. Our ARTEX analysis covers Cases B and E in detail, with the published indicators.
What was taken, and the regulators' answer
119 notices list the data at risk:
- Identity fields: 18 include date of birth together with a real name and a phone number or email address, the combination used in identity checks.
- Passwords: 38 notices state a password status. 14 say passwords were in scope (12 hashed, 2 with storage not stated), 10 say this is not confirmed, and 14 that no passwords were involved.
When name, birth date, address and phone are in leaked lists, they stop proving identity. On 9 October the FSA asked financial institutions to look harder at ID-document images in online identity checks, and to review third-party risk management and incident response. The PPC's 7 October alert previews phishing-resistant MFA, log analysis and EDR as expected safeguards.
Three organisations in the dataset also appear on ransomware leak sites, according to ransomware.live:
- Kissei Shoji and Unirita, listed by everest;
- enTouch, listed by Black X.
A listing is the criminal group's claim, not confirmation, and it may concern a different incident from the notice.
The attacker's playbook: why these routes pay
The routes above are not random. Each one lowers the attacker's cost per victim.
- Scan widely, exploit the known. Test each target for many known flaws and for leftover configuration and backup files (Case A; T1595.002, T1190). Analytics tools such as Metabase were left on the internet and patched late (Case C).
- Study one site, take its data through its own functions. Read the public app, list its API calls, then call the ones the app never uses, with forged headers and malformed tokens (Case B; T1190). Spread requests over Tor and residential proxies and copy the app's User-Agent so that per-address blocking and simple filters see nothing (T1090.003). This per-site work used to cost days of skilled time; agents that plan, call tools and keep going after a block cut that cost, which is what Macnica and NICT warn about.
- Hit a platform, get many victims. A community service, a site builder, a booking system, an enquiry service or a cloud provider holds many organisations' data at once (T1199). One intrusion becomes dozens of notices, from companies that never ran the system. From the attacker's side this is leverage; from a risk manager's side, it is correlation.
- Stay where the server is reachable. A web shell on an application server keeps access after the first route is closed (Case D; T1505.003).
- Monetise. Sell or extort with the data, or encrypt the infrastructure (T1486). At a provider, encryption alone stops hundreds of customers, as IDC Frontier showed.
The risk model
An operational-risk team in a bank would recognise the structure: the loss distribution approach (LDA) models how often losses happen (frequency) and how big each one is (severity), then combines them by simulation. Supply-chain risk adds what the standard LDA leaves out: dependence, where one event at a supplier causes losses at many firms at once. We fit each piece to Japan's notices, then show what dependence does.
Everything below runs from two CSVs with one Python script, standard library only, fixed seed. The figures in this article are copied from its output file.
Frequency: two processes, one steady and one in bursts
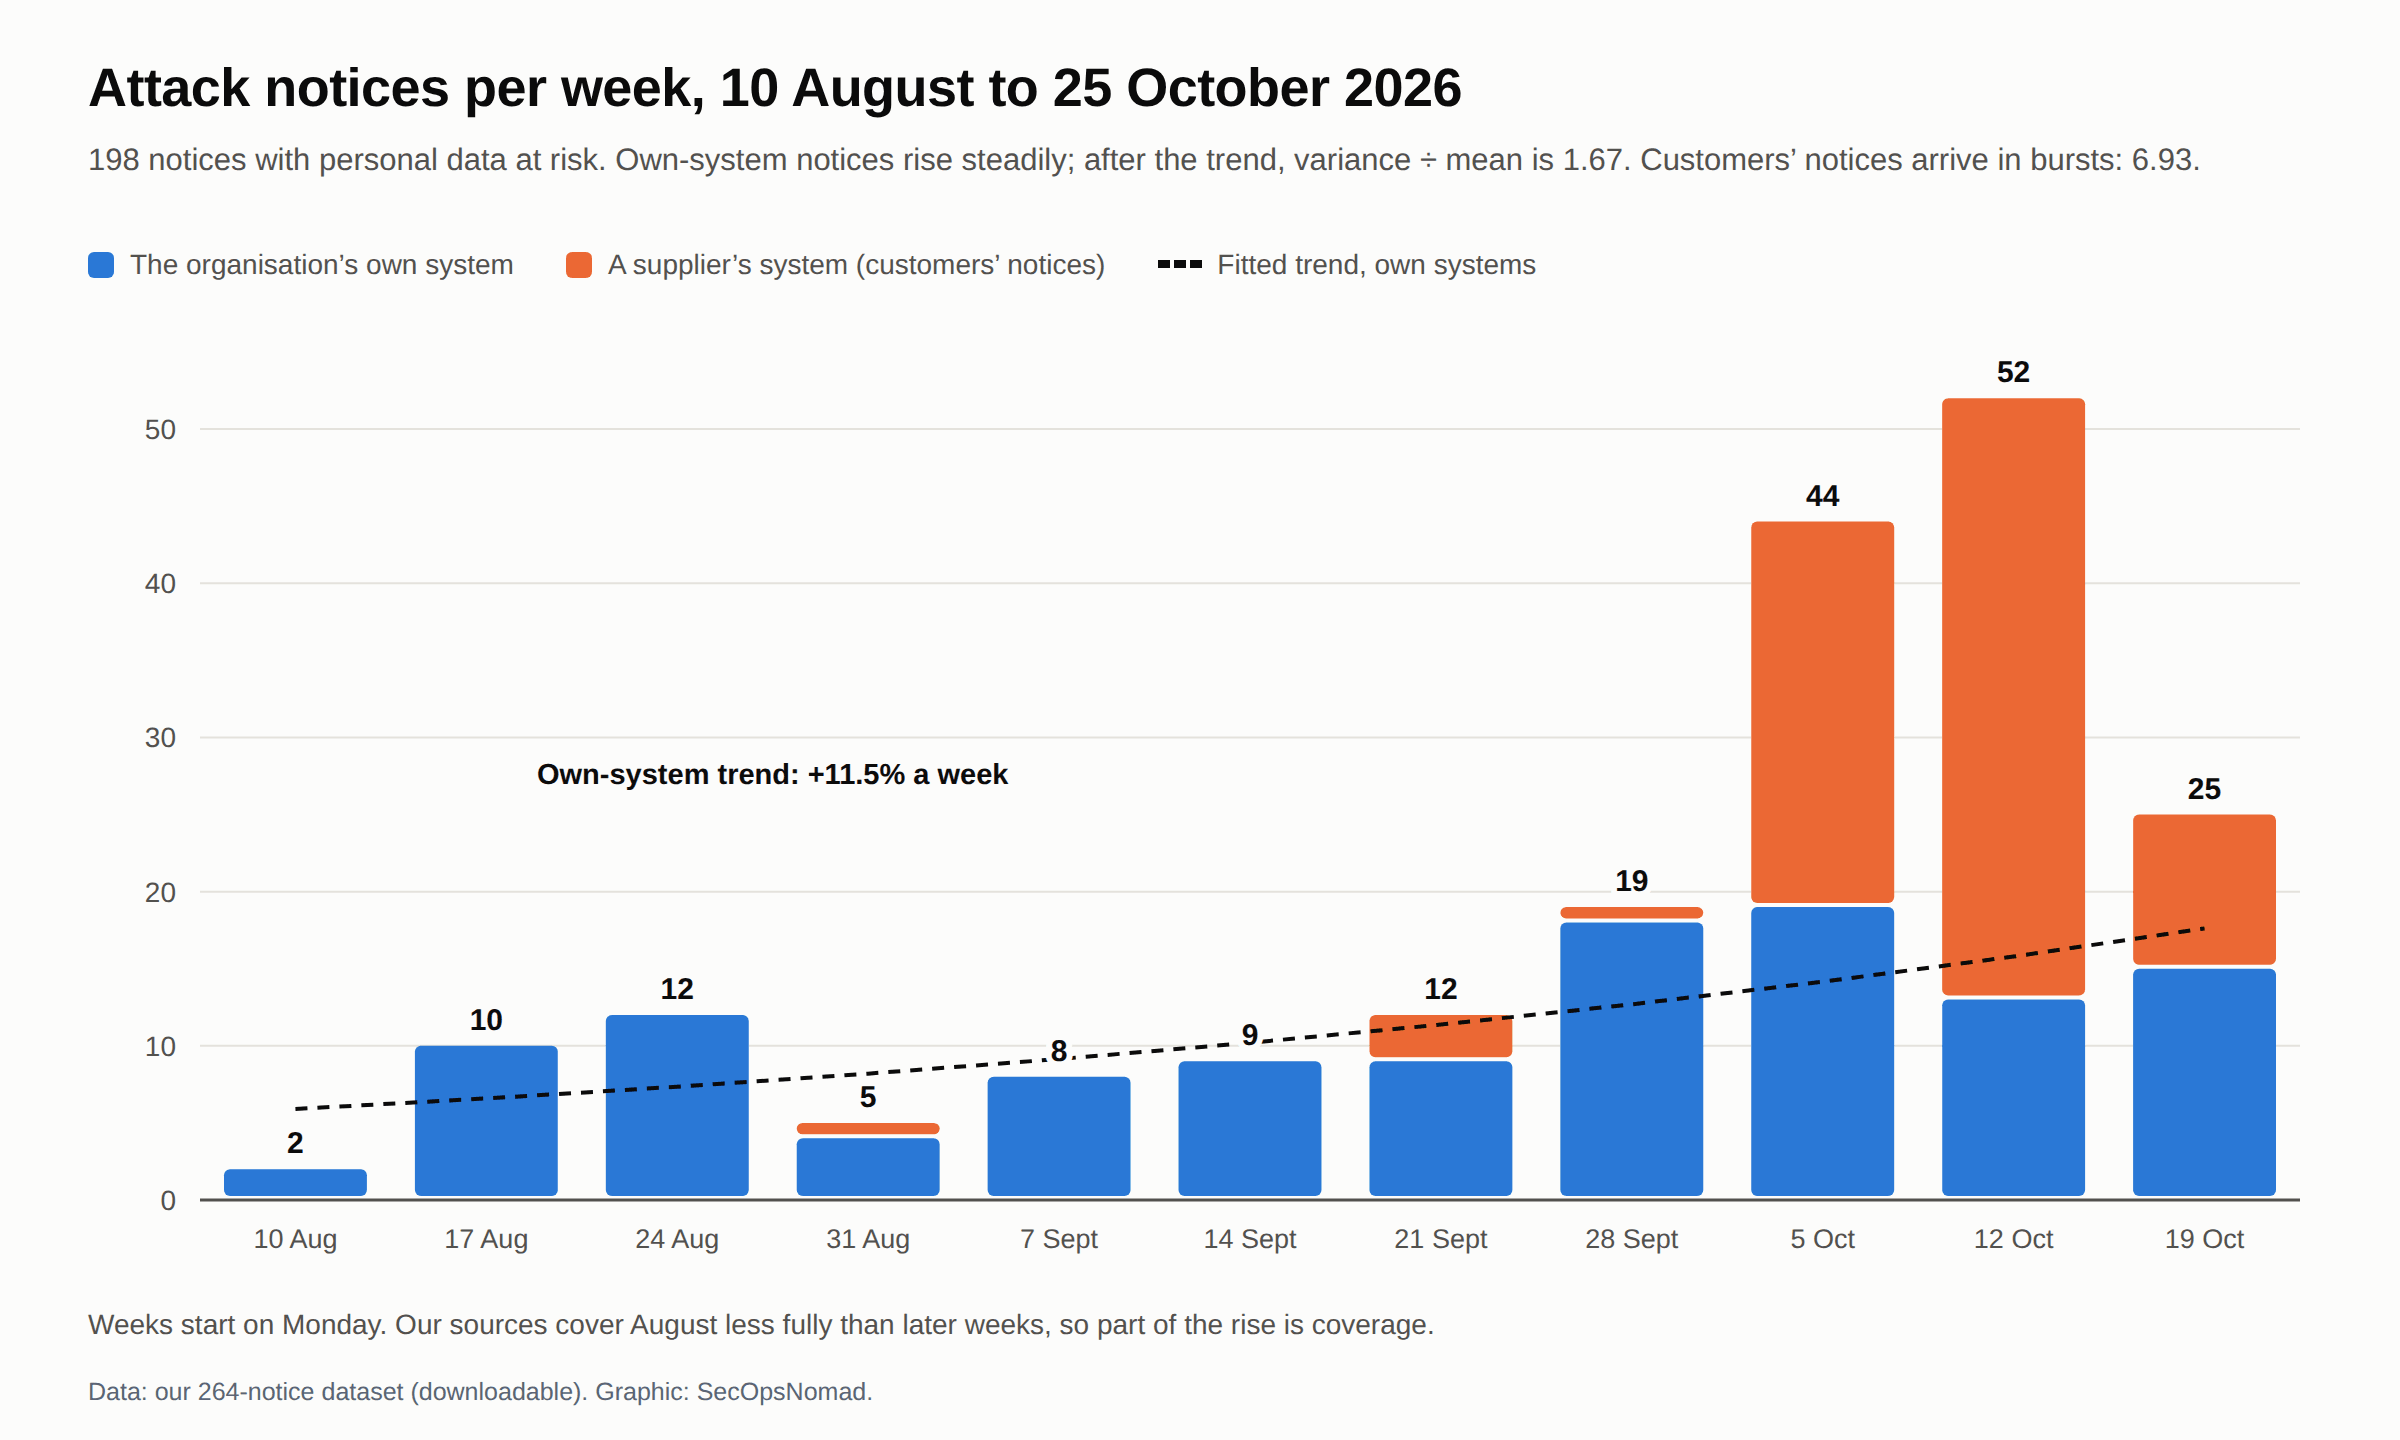
Figure 2. Attack notices per week, by whose system was breached. Original graphic for this article, from our dataset.
| Weekly counts, 11 weeks | Mean | Variance ÷ mean | Poisson test | Trend a week | Variance ÷ mean after the trend |
|---|---|---|---|---|---|
| All 198 attack notices | 18.0 | 14.58 | p < 0.001 | +25.7% | 4.52 (p < 0.001) |
| 119 about the organisation's own system | 10.82 | 2.60 | p = 0.004 | +11.5% | 1.67 (p = 0.091) |
| 79 from customers about a supplier's system | 7.18 | 23.53 | p < 0.001 | +69.5% | 6.93 (p < 0.001) |
A Poisson process with a steady rate gives a variance-to-mean ratio near 1. All attack notices together give 14.6, and a rising trend does not remove it. Split them by whose system was breached and the picture separates:
- Own-system notices rise steadily. A log-linear trend of about 11.5% a week removes most of the excess; what remains is consistent with Poisson (1.67, p = 0.09). Part of the rise is real: Macnica's count turns up in July, and officials called the situation critical in October. Part is coverage: our sources cover August less fully than later weeks.
- Customers' notices arrive in bursts. There are almost none until late September, then 25, 39 and 10 in the last three weeks. No trend removes that (6.93). These notices are not independent events: each burst is one supplier incident.
So the frequency model has two parts. Own-system incidents are a Poisson process with a time-varying rate. Supplier incidents are a cluster process: an incident arrives, then a random, heavy-tailed number of customer notices follows within days. A single negative binomial fitted to all notices (size 1.33) blends the two and hides where the variance comes from. Treat alerts such as JPCERT/CC's of 8 October as a sign that the rate has changed, and a supplier's notice as the start of a cluster.
Severity: a tail index below 1, bending at the top
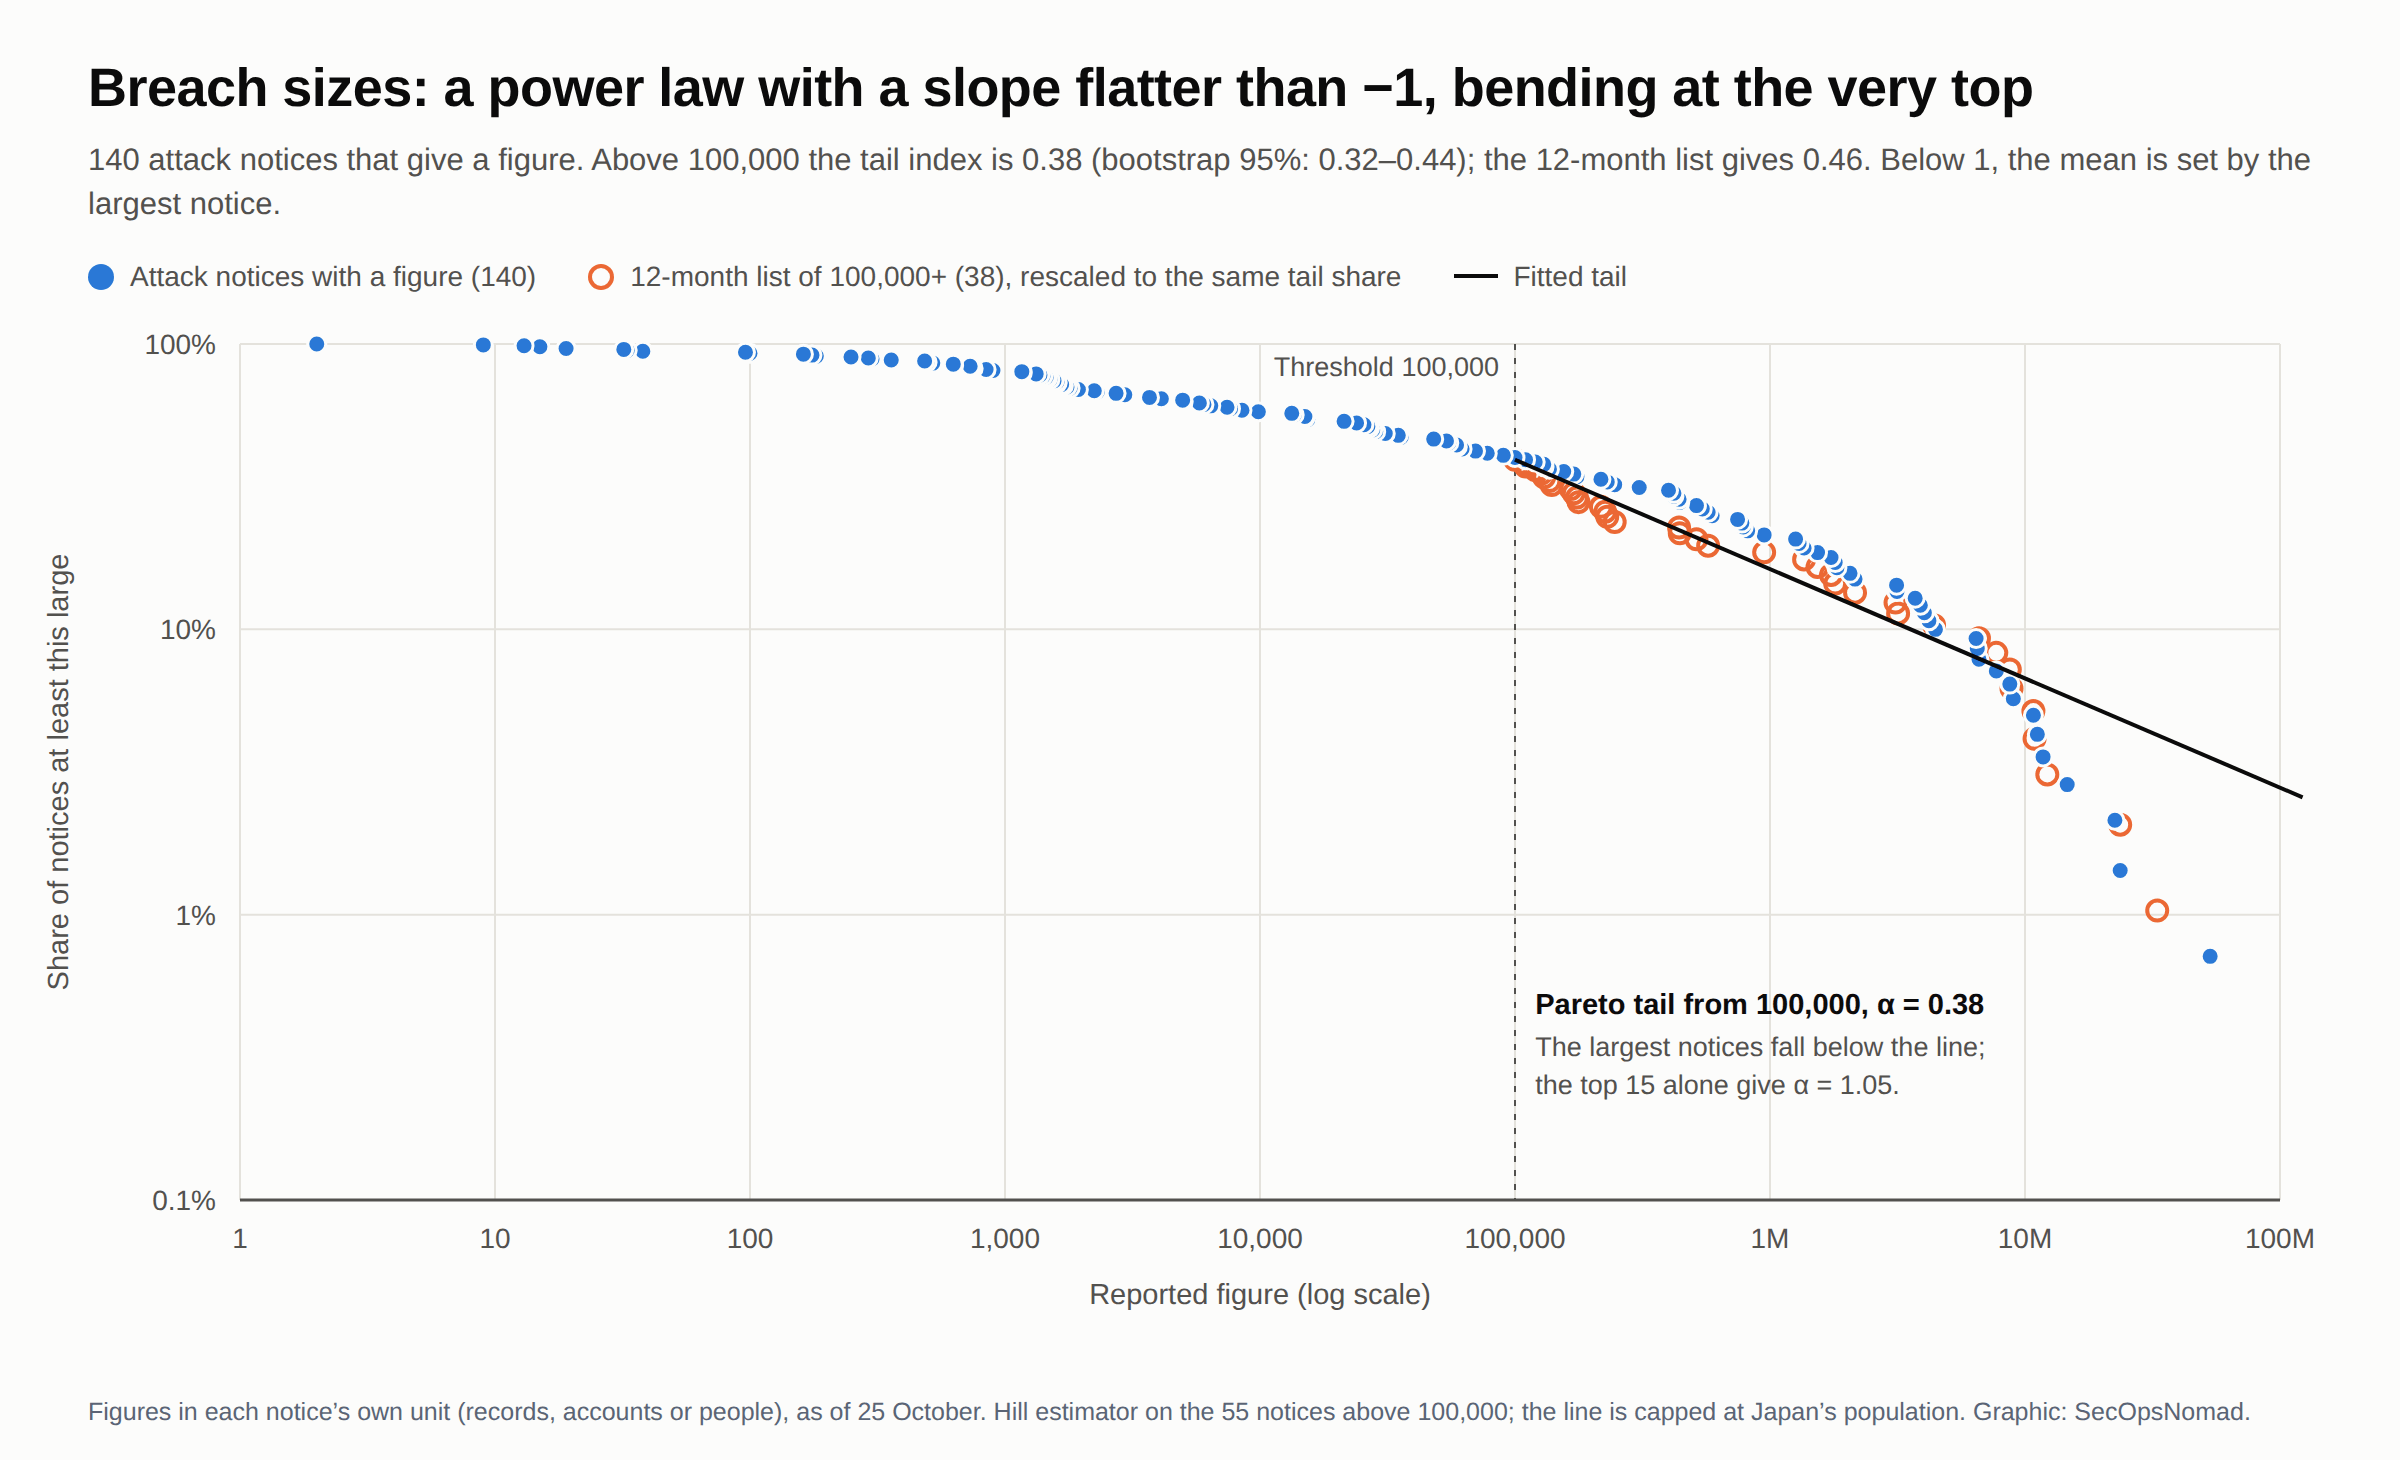
Figure 3. Reported breach sizes on a log-log scale. Original graphic for this article, from our datasets.
140 of the 198 attack notices give a figure. The median is about 27,300; the total is 246,011,916, about twice Japan's population, in mixed units and with duplicates. The largest three (Sagawa Express, Gyazo and SourceNext) are 40.4% of that total, and Sagawa's up to about 53.23 million is 21.6% on its own.
Above 100,000 (55 notices), the Hill estimator puts the tail index at 0.38. 2,000 bootstrap resamples give a 95% interval of 0.32 to 0.44. Some figures are ceilings: IDC Frontier's customers said data “may have been viewed”, and some later found no leak. Without them the index is 0.385, so they do not drive it. The 12-month list of 38 disclosures of 100,000 or more, compiled separately over a longer window, gives 0.46.
The bootstrap resamples notices individually. It does not preserve supplier clusters or correct for selective disclosure, mixed units or uncertainty in reported ceilings. Its interval describes this resampling model, not a population-level confidence statement about all Japanese breaches.
The tail bends at the very top. Fit the index to the largest notices only, and it rises:
| Notices used (the largest) | Threshold | Tail index |
|---|---|---|
| 15 | 4,030,000 | 1.05 |
| 20 | 2,155,345 | 0.77 |
| 30 | 817,215 | 0.58 |
| 40 | 420,000 | 0.53 |
| 55 | 100,000 | 0.38 |
A pure power law gives about the same index whichever threshold you take. Here the middle of the tail, from 100,000 to a few million, is very heavy and the top is thinner. That is consistent with finite service populations, but does not establish a physical ceiling at Japan's population: accounts, transactions and duplicate records can exceed a count of people, and services can have overseas customers. The population-based cap below is an illustrative modelling assumption. A single Pareto tail fitted from 100,000 can overstate the chance of notices far beyond any seen so far, and the cap you choose does real work.
What α below 1 means. For a Pareto tail with α ≤ 1 the mean is infinite. In practice, the average of any sample is dominated by its largest member, and the next large notice moves it: Sagawa's late figure alone added 53 million to the total. Report quantiles, not averages, and state the cap you used.
A retrospective cross-check against a second list. The tail fitted to our notices predicts how many large notices each list should hold:
| Size | Our notices: predicted | Observed | 12-month list: predicted | Observed |
|---|---|---|---|---|
| 1 million or more | 22.8 | 29 | 15.7 | 17 |
| 10 million or more | 9.4 | 7 | 6.5 | 5 |
Both lists show the same pattern: more notices of a million or more than the line predicts, and fewer of 10 million or more. The second list was compiled separately, but shares incidents with the combined dataset; this comparison is not independent validation or a forecast test on unseen incidents. The seven of 10 million or more in our notices are Sagawa Express, Gyazo, SourceNext, skyticket (14,640,000), Capcom (11,774,247 CAPCOM ID accounts), the Burger King Japan app (11,180,000) and the Yakiniku King app (10,788,963).
A caution. A lognormal fitted to all 140 figures (μ = 10.193, σ = 3.828 on natural logs) also fits the range we observe. With this many points you cannot tell a lognormal from a Pareto tail, and the two give very different answers beyond the data. That is model risk, and the next section measures it.
Aggregate: how much the model choice matters
We combined the frequency (663.6 notices with a figure a year, variance-to-mean 15.84) with three severity models, each capped at Japan's population for a single notice, and simulated 40,000 years. The frequency annualises the 11 weeks, so it carries October's rate into a whole year; read the levels as a stress, not a forecast.
| Severity model | Median year | 99.5th percentile | 99.9th percentile |
|---|---|---|---|
| Empirical: resample the 140 figures | 1,151M | 1,830M | 1,982M |
| Lognormal fitted to all 140 | 2,496M | 4,198M | 4,590M |
| Spliced: resample below 100,000, Pareto tail above | 3,343M | 5,548M | 6,041M |
Annual totals of reported records, in each notice's own unit, not people and not yen.
Two results matter more than the levels:
- Model choice moves the 99.9th percentile by about three times. The empirical model can never produce a notice larger than the largest one already seen; the parametric tails can. The data alone does not choose between them, although the bend at the top favours the more restrained answers.
- The cap sets the mean. For the spliced model, the expected annual total is 2,020M with a cap at 53.23 million (the largest notice so far), 3,388M at Japan's population and 12,392M at 1 billion. When a mean depends on an assumption by a factor of six, the assumption is the model.
This is why the Basel Committee's advanced measurement approaches, which asked banks for a one-year 99.9th percentile of operational losses, were hard to validate when losses are heavy-tailed and data are few, and why the Basel framework leaned on scenario analysis for the tail. The standardised approach that replaced them scales capital by a bank's own history instead: 15 times average annual losses over ten years. With a tail index below 1, a ten-year average is itself unstable: one event can set it.
Supplier risk as a common shock
Now the supply-chain part. Take a portfolio of 1,000 firms: a bank's corporate clients, an insurer's cyber book or a group's subsidiaries. Each has a 3% chance a year of an incident of its own. Each also depends on a critical service. The provider of that service has a 2% chance a year of an incident that reaches its customers, and when it happens, half of its customers are affected.
The expected count of firm-level incident impacts is 30 + 10 = 40 a year whatever the market structure. Only the concentration changes.
Counting convention: the code adds own-system and supplier impacts. A firm hit through both routes is counted twice, so the table and figure count firm-level incident impacts, not distinct firms affected during a year. Under these assumptions the expected number of distinct firms is 1,000 × [1 − (1 − 0.03)(1 − 0.02 × 0.5)] = 39.7; the displayed percentiles apply to the summed impacts, not that deduplicated measure.
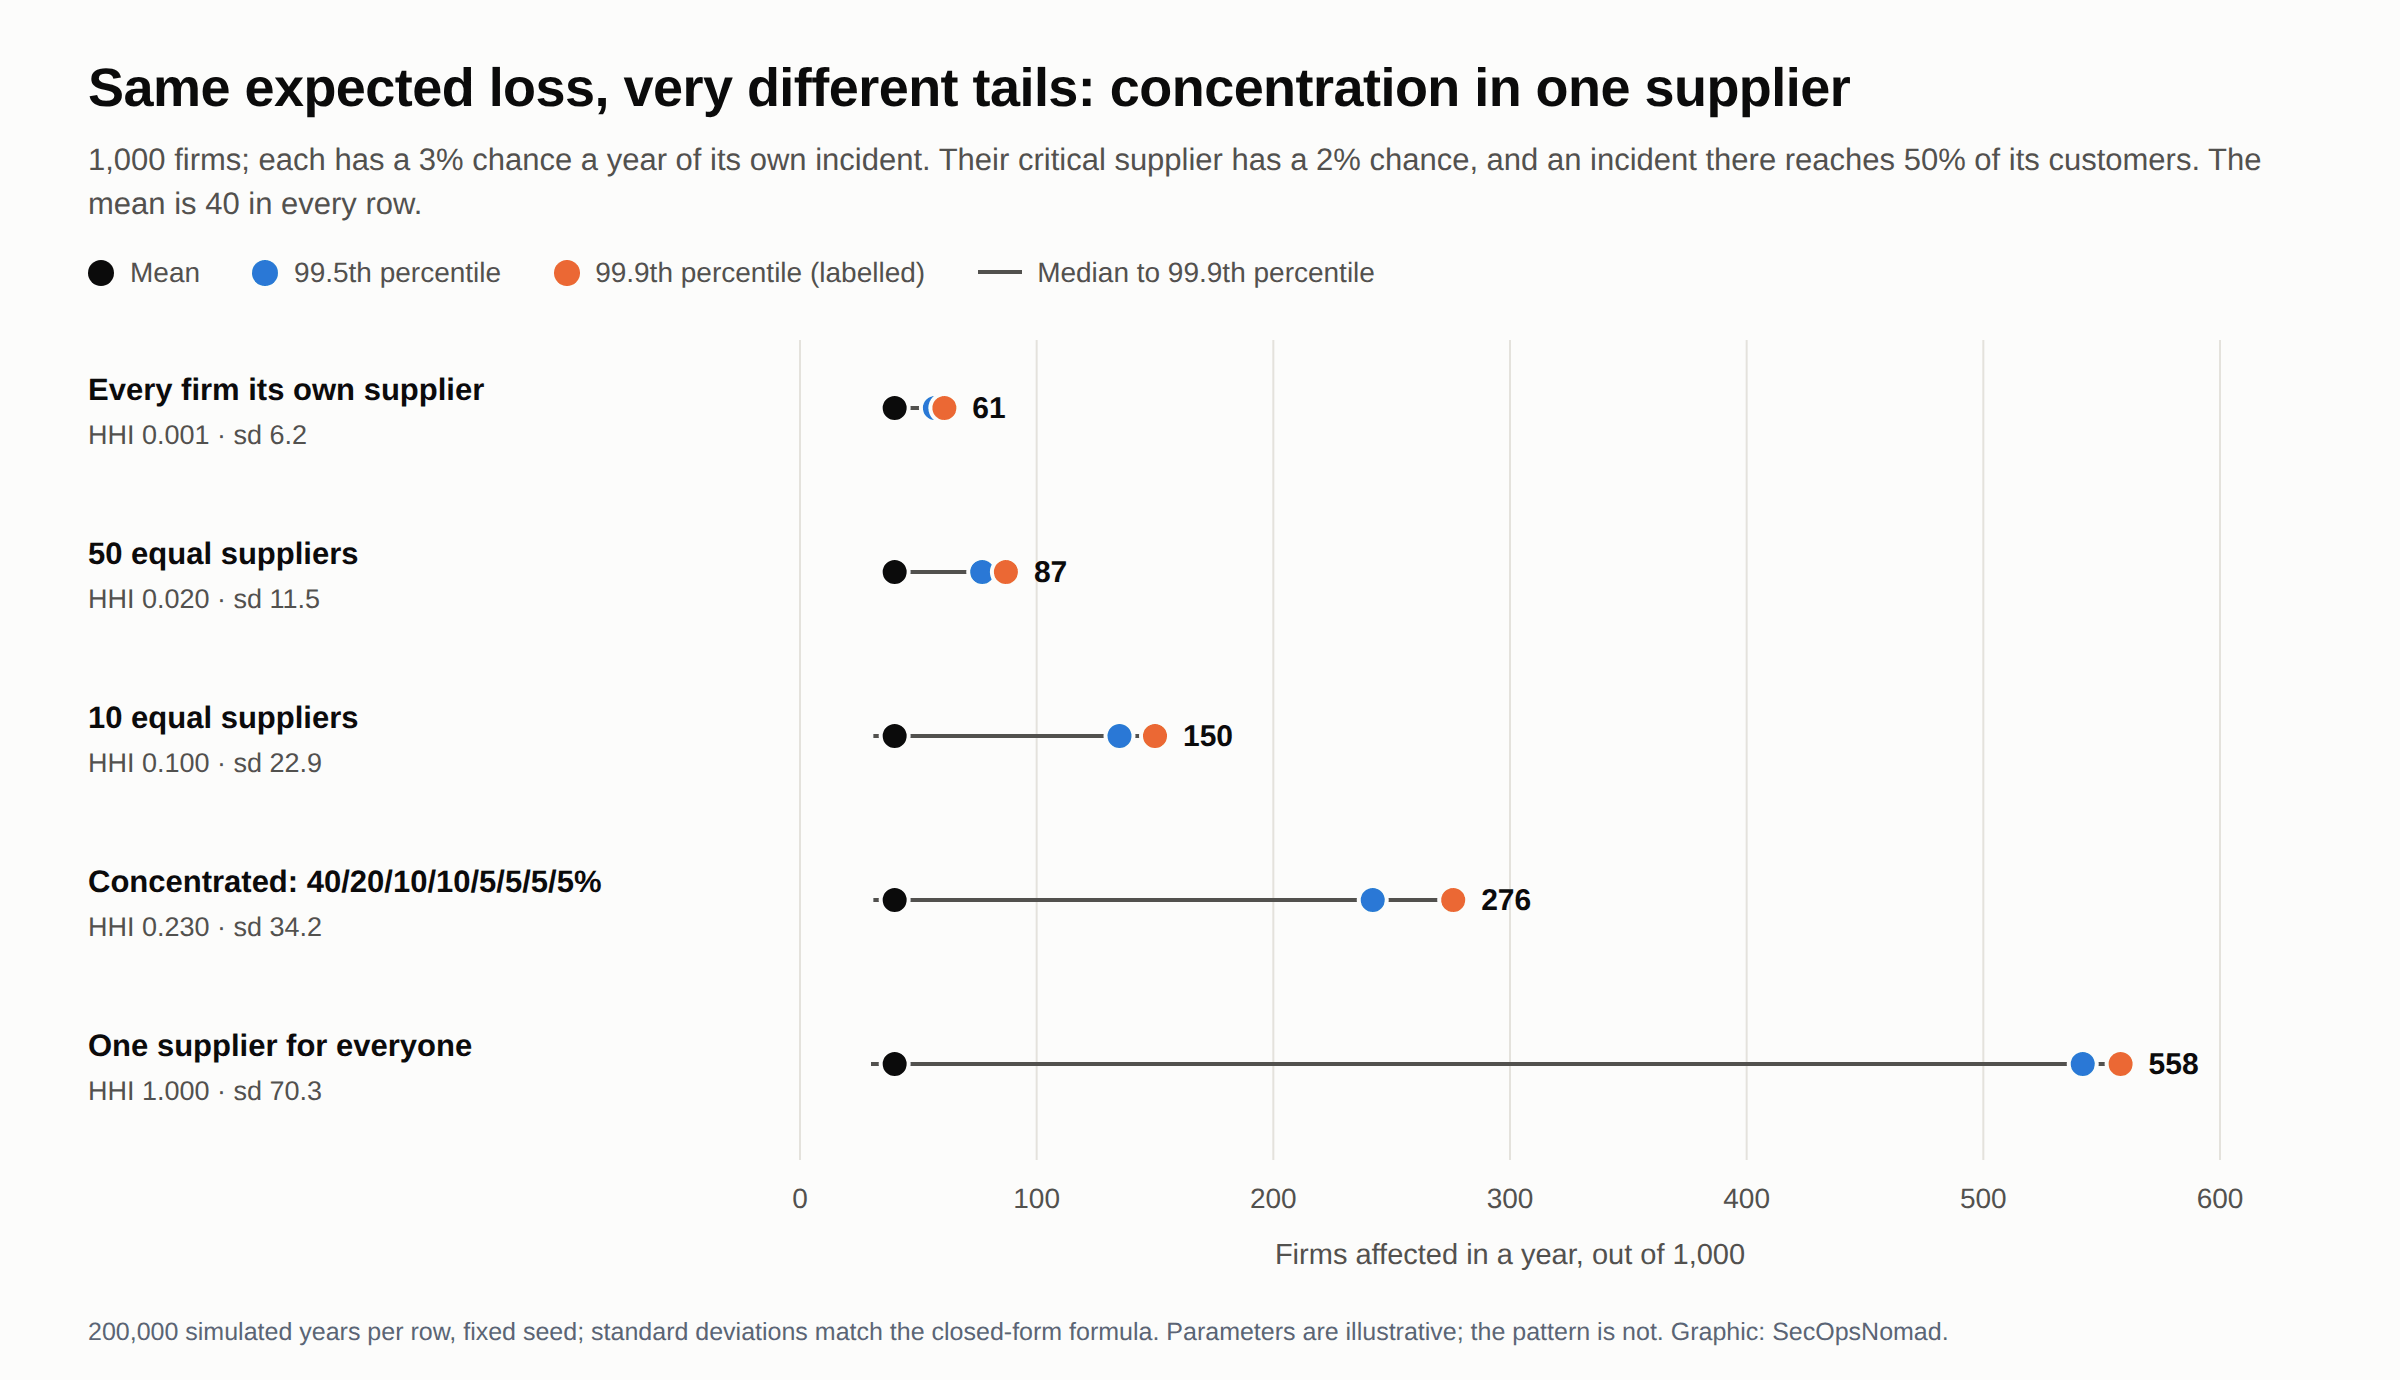
Figure 4. The same expected incident-impact count under five supplier structures. The graphic's firm counts sum both routes and do not deduplicate firms hit twice. 200,000 simulated years per row. Original graphic for this article.
| Supplier structure | HHI | Mean | Standard deviation (simulated / formula) | 99.5th percentile | 99.9th percentile | Chance of 100 or more impacts in a year |
|---|---|---|---|---|---|---|
| Every firm its own supplier | 0.001 | 40.0 | 6.2 / 6.2 | 57 | 61 | 0.00% |
| 50 equal suppliers | 0.020 | 40.0 | 11.5 / 11.5 | 77 | 87 | 0.01% |
| 10 equal suppliers | 0.100 | 40.0 | 22.9 / 22.9 | 135 | 150 | 1.69% |
| Concentrated: 40/20/10/10/5/5/5/5% | 0.230 | 40.0 | 34.2 / 34.1 | 242 | 276 | 4.27% |
| One supplier for everyone | 1.000 | 40.0 | 70.3 / 70.2 | 542 | 558 | 2.00% |
The variance has a closed form, which is also our check on the simulation. With M firms, own-incident probability p₀, supplier-incident probability q, hit rate h and market shares sj:
Var = M·p₀(1−p₀) + q·h(1−h)·M + q(1−q)·h²·M²·HHI, where HHI = Σ sj².
The first two terms do not depend on market structure. The last grows with the Herfindahl–Hirschman index, the concentration measure competition authorities use. So once concentration dominates, the standard deviation grows with √HHI, and the 99.9th percentile rises ninefold while the mean does not move.
What this means in practice:
- Mean-only comparisons miss concentration. If cost per impact is held equal, a comparison based only on expected loss is the same in every row. Only tail measures, capital or concentration limits respond.
- HHI is not the whole story. The concentrated market has a higher chance of 100 or more firm-level impacts (4.27%) than a single supplier (2.00%): two large providers each have a 2% chance of failing, and either one is enough. Look at the largest shares as well as the index.
- This is how credit-portfolio models treat default correlation. A common factor raises many obligors' default probabilities at once; CreditRisk+ uses a gamma-distributed sector factor, the same Poisson–gamma mixture that gives the negative binomial above. The supplier is the sector.
Calibrating the shock on Japan's notices
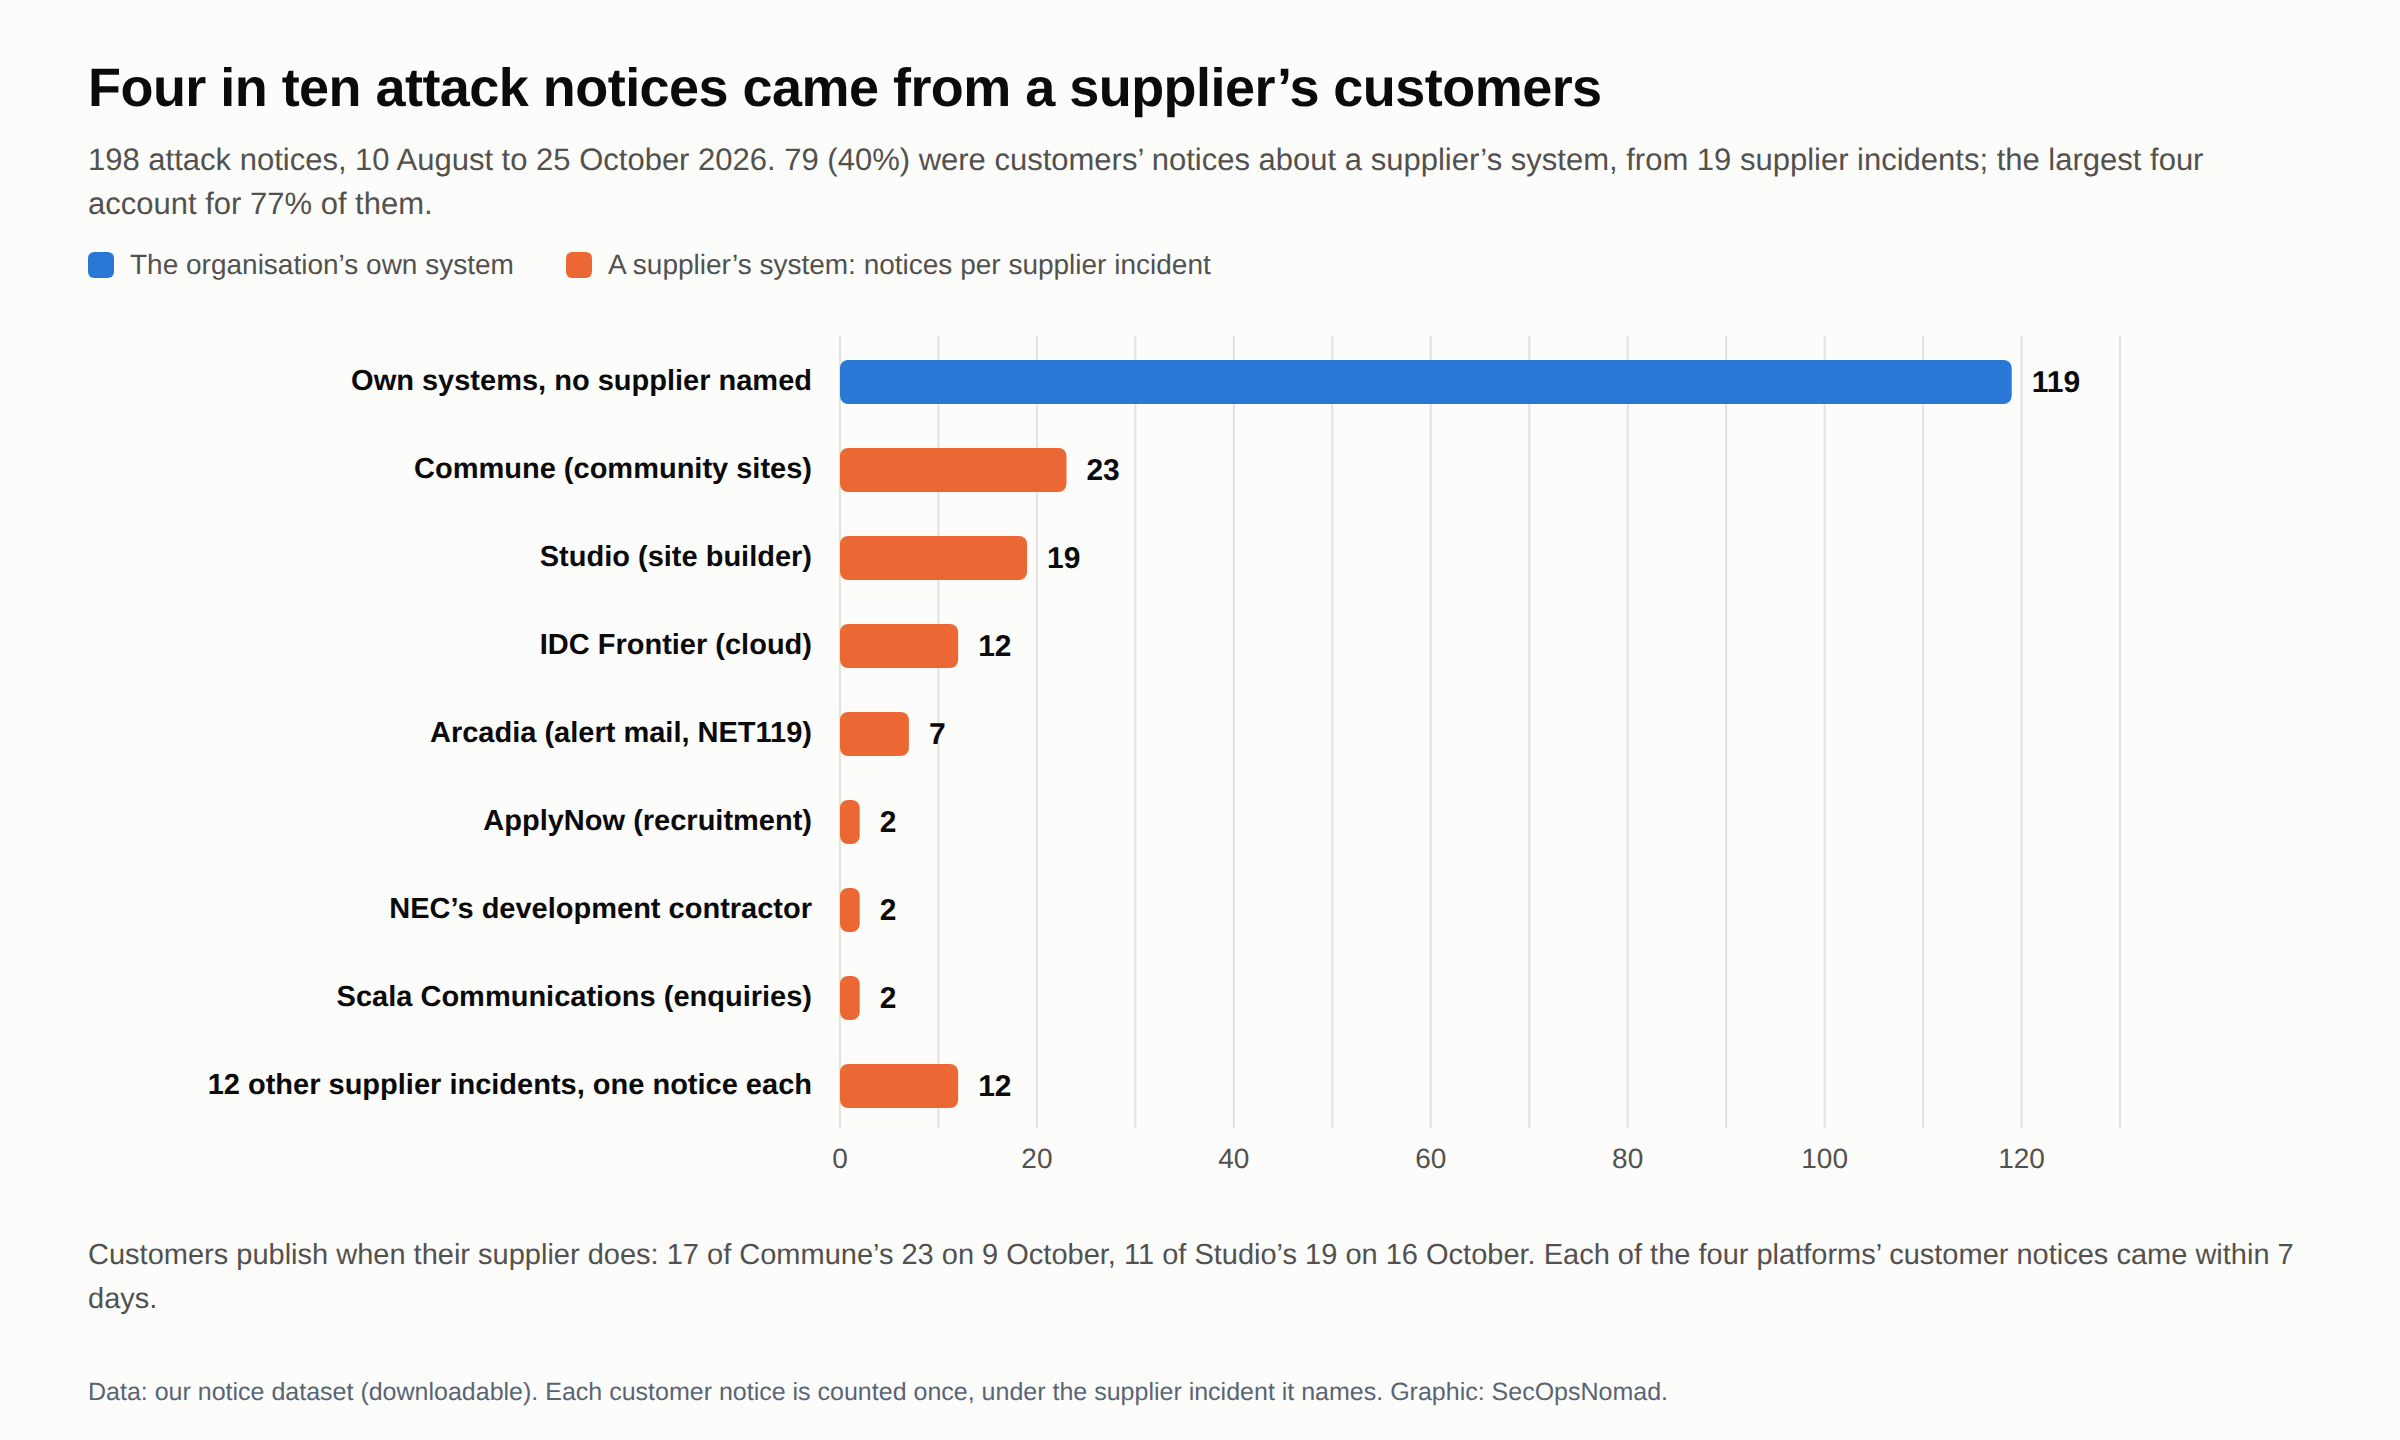
Figure 5. Attack notices by the system they concern. Original graphic for this article, from our dataset.
79 of the 198 attack notices (40%) came from customers reporting a supplier's system, from 19 supplier incidents. Four platforms account for 61 of them (77%): Commune with 23, Studio with 19 (a 20th customer's notice did not say personal data was at risk), IDC Frontier with 12 and Arcadia with 7. The other 15 incidents produced 18 notices: ApplyNow, NEC's development contractor and Scala Communications two each, and twelve with one.
- Customers publish together. 17 of Commune's 23 customer notices came on 9 October, the day Commune published its own; 11 of Studio's 19 came on 16 October, the day Studio did. Each of the four platforms' customer notices fell within 7 days. The 12 Studio customers that give a discovery date all give 16 October, the day Studio told them. Unrelated companies discovering and disclosing on the same day is the fingerprint of a shared supplier. It is the event the common-shock model describes: one draw that lands on many firms.
- Cascade sizes are heavy-tailed: 23, 19, 12 and 7, then 2, 2 and 2, then twelve of 1. In the model, q·h should be drawn from a distribution rather than fixed.
- Notices still undercount the shock. IDC Frontier's one incident affected 495 customers; 12 of them published a notice in our dataset that puts personal data at risk, about 2.4%. Most customers of a breached platform never publish anything. If you calibrate on notice counts, you will underestimate q·h and, more importantly, the concentration term.
Late figures and reporting lags: incurred but not reported
Five notices gave their figure only in a later report:
- Fuso Dentsu, 47 days later.
- Sagawa Express, 23 days later. Its fifth report (23 October) gives up to about 53.23 million records, duplicates included. They cover waybill data from 21 June to 30 September, customer lists and Smart Club members, with no card data or passwords (INTERNET Watch · Impress Watch). It is now the largest figure in the dataset.
- Moonstar, 13 days later: up to 593,000 people.
- Comic Seymour, 6 days later: up to about 4.2 million records, in its fourth report (21 October).
- Trust Bank's Furusato Choice, a day later: 4,454,097 records.
One notice, JOGMEC's of 2 October about some 8,500 email addresses, reached our list 23 days after it was published.
Insurers call this incurred but not reported (IBNR): losses that belong to a period but are reported, or sized, later. A model fitted to figures disclosed by a cut-off date understates both frequency and severity. The standard correction is a set of development factors, built from how counts and figures move between first notice and final report.
Where the notices give the dates:
- Discovery to notice: a median of 2 days (72 notices; 75% within 3 days; the longest 34).
- Access to discovery: a median of 2 days, 75% within 13 and the longest 25 (25 notices).
- Access to notice: a median of 6 days, 75% within 16 and the longest 141 (41 notices).
Notices that give an access date tend to be the ones found quickly, so these lags are a lower bound. Once a company knows, it tells quickly; the delay is in knowing. The disclosure clock you can count runs about a week behind the attack clock at the median, and months behind at the tail.
What the model should look like
- Frequency: own-system incidents as a Poisson process with a time-varying rate; supplier incidents as a cluster process, where each incident brings a heavy-tailed number of customer notices within days.
- Severity: at least two severity models, reported as quantiles with an explicit cap. Stress the tail index across its bootstrap interval (0.32 to 0.44), and let the tail thin near the ceiling rather than run on.
- Supply chain: the common shock above, with q·h calibrated on cascades like these and scaled up for the customers who publish nothing.
- Data: development factors before fitting, because the first count and the first figure both move.
Where this sits in the frameworks you already use
| Framework | What it asks | What the model above gives it |
|---|---|---|
| Open FAIR risk taxonomy | Loss event frequency and loss magnitude, estimated separately and simulated | The frequency and severity split. Use reported records only as a driver of loss magnitude, not as the loss |
| Basel framework, advanced measurement approaches | One-year 99.9th percentile; scenario analysis for heavy tails | The aggregate section: how far the tail moves with the model |
| Basel III standardised approach | Capital scaled by 15 times average annual losses over ten years | A warning: with α below 1, that average is set by the worst year |
| BCBS principles for third-party risk, December 2025 | Bank-level and systemic concentration; key nth parties for critical services; supervisors to look for systemic concentration | The common-shock model and its HHI term |
| EU DORA, Regulation (EU) 2022/2554 | Article 28: ICT third-party risk and a register of arrangements. Article 29: assess ICT concentration risk before contracting | The same test, before you sign |
| FSA cybersecurity guideline for the financial sector, October 2024 | Third-party risk management as one of its areas, alongside governance, identification, protection, detection, and response and recovery | The supplier inventory the model needs |
| NIST SP 800-161r1 | Cybersecurity supply-chain risk management: supplier criticality and dependencies | Which suppliers belong in the model |
The BCBS principles were published on 10 December 2025; the FSA guideline's third-party section is summarised by PwC Japan. We could not open the BIS, FSA or EUR-Lex pages from our environment on 25 October; the descriptions above rely on the documents' own text as quoted in search results and on those summaries.
The defender's and risk manager's playbook
- Inventory dependence, not contracts. For each critical service, record the share of revenue, customers or records that depends on it, and the provider's own key providers (the BCBS's nth parties). Compute the HHI and the largest share.
- Write supplier scenarios as one event with many losses. Use the scenario card below. A supplier incident is not 500 independent incidents; it is one draw that lands on 500 firms.
- Model a time-varying rate. Refresh frequency monthly from notices and alerts. Treat a JPCERT/CC or National Cybersecurity Office alert as a change of rate, not noise, and a supplier's notice as the start of a cluster.
- Report severity as quantiles with an explicit cap. Run at least two severity models and report the spread between them as model risk.
- Connect the model to telemetry. The routes above have detections: our breach review's JPCERT/CC indicator query, analytics-tool exposure query and bulk-download query; the ARTEX indicators; and the PHP2Shell rules for Sentinel and CrowdStrike. Detection hits feed the frequency estimate for your own firm.
- Know your reporting clock. Under Japan's personal information law, a leak caused by unauthorised access needs a prompt preliminary report to the PPC (the guidelines say roughly three to five days) and a final report within 60 days. Contract notice periods from suppliers have to fit inside that.
Key risk indicators that move the tail:
| Indicator | How to measure it | Why it matters |
|---|---|---|
| Supplier concentration | HHI and largest single share of critical services, by revenue or customers served | The M²·HHI term in the variance |
| Nth-party visibility | Share of critical suppliers whose own critical providers you know | A shared cloud or data centre two steps away is still one shock |
| Supplier notification lag | Hours from a supplier's discovery to your being told | Sets whether you can meet the PPC's clock |
| Exposure time | Days from a JPCERT/CC alert or known-exploited listing to a fix on internet-facing systems | Cases A and C exploit known flaws |
| Object-level API checks | Share of customer-facing endpoints that pass a two-account test | Case B and the largest API leaks; see our API guide |
| Deletion at contract end | Share of ended contracts with verified deletion | ApplyNow still held applicants' data for customers whose contracts had ended |
Scenario card
Scenario: [supplier / service] incident that reaches its customers
Critical service: [what it does for you]
Supplier: [name]    Key nth parties: [cloud, data centre, software it depends on]
Share of your business that depends on it: [x% of revenue / y customers / z records]
Share of your portfolio or sector that uses it: [s%]    HHI contribution: [s squared]
Trigger: [ransomware at the provider / API flaw / stolen admin credentials / outage]
Frequency q: [per year]    Source: [notice history, CERT alert, provider attestation]
Hit rate h: [share of customers affected]    Source: [comparable incident, e.g. IDC Frontier, 7 Oct 2026, 495 customers]
Your loss if it happens: primary [restoration, overtime, refunds]; secondary [notification, regulator, claims]
Notice from the supplier: contract [hours]; tested on [date]
Our PPC reports: preliminary by [date]; final by [date]
Exit or substitute: [days to switch]; tested on [date]
Owner: [name]    Reviewed: [date]    Next review: [date or trigger]
Data and code
- 264 notices, 10 August to 25 October 2026 (CSV): notice date, organisation, category, route, the supplier incident a customer's notice names, the figure and its wording in English and Japanese, the date a later report gave the figure, what happened, dates of access and discovery where the notice gives them, data fields, password status, the notice we relied on and a second source.
- 38 disclosures of 100,000 or more, September 2025 to October 2026 (CSV).
- The model (Python, standard library only). Put it in the same folder as the two CSVs and run
python3 japan-breach-risk-model.py; it takes under a minute. - Its output (JSON). Every number in this article's model sections comes from this file. The fixed seed makes it identical on every run.
Both CSVs are UTF-8 with a byte-order mark, so Excel opens the Japanese text correctly. Excel shows the ISO dates in your own date format. If you save the file from Excel, choose “CSV UTF-8”; other CSV formats can lose the Japanese text.
What remains unknown
- How most attackers got in. 63 of the 119 own-system notices do not say, nor do 6 of the 19 supplier incidents. Our route shares describe the ones that do, and those may not be typical.
- What is missing from the data. Notices are what organisations chose to publish and what our sources found. Coverage is thinner in August than in October, and incidents with no personal data at risk are logged less consistently than breaches, so the frequency model uses the 198 attack notices only. Not every row has every field: 119 list the data at risk, 108 carry a second source and 72 give both a discovery and a notice date.
- Units. Figures mix records, accounts and people, and many are ceilings (“up to”, “possible”). Nothing here is a count of people or a loss in yen.
- Supplier parameters. The common-shock model's 3%, 2% and 50% are illustrative. The shape of the result does not depend on them; the levels do.
- Tools and victims. No victim, regulator or CERT has linked an AI penetration-testing tool to any named Japanese breach.
Sources and updates
Update history.
- 27 October 2026. The two CSVs now start with a UTF-8 byte-order mark. Without it, Excel read them as Shift_JIS, garbled the Japanese text and shifted the columns. No values changed.
- 25 October 2026, 16:15 JST. The dataset now runs from 10 August to 25 October: 264 notices in one CSV, with access and discovery dates, data fields and second sources where we have them. Every table and figure was recomputed on the combined set. New: the split between own-system and supplier notices, the bend at the top of the tail with a bootstrap interval, supplier cascades (Figure 5), late figures and reporting lags, the data at risk, and timeline rows for the PPC, FSA, Commune, Studio, Capcom, Sagawa Express's fifth report and FutureShop. Sagawa's figure is taken from INTERNET Watch and Impress Watch because its notice page needs JavaScript.
- 25 October 2026, 12:30 JST. First published. JPCERT/CC's, the BIS's, the FSA's and EUR-Lex's pages could not be opened from our environment on 25 October. JPCERT/CC's Cases A, B, C and E are as checked for our ARTEX analysis on 24 October; Case D comes from secondary summaries; the frameworks are described from their own text as quoted in search results.
Alerts, responders and government
- JPCERT/CC, JPCERT-AT-2026-0030 and its updates of 9 and 23 October 2026 (Japanese)
- JPCERT/CC, JPCERT-AT-2026-0023, Metabase, 14 August 2026 (Japanese)
- issoh, summary of the Case D update (Japanese)
- Macnica, web-system breaches in 2026, 7 October 2026 (Japanese)
- NICT, A2B alert, 13 October 2026 (Japanese)
- CrowdStrike, ARTEX against South Korean finance, 7 October 2026
- piyolog, ARTEX repository history (Japanese)
- National Cybersecurity Office, 30 September 2026 (Japanese, PDF)
- Impress Watch, ministries' emergency meeting, 8 October 2026 (Japanese)
- INTERNET Watch, National Cybersecurity Office alert, 9 October 2026 (Japanese)
- Yomiuri via Yahoo! Japan, LDP headquarters, 9 October 2026 (Japanese)
- Personal Information Protection Commission, leak reporting (Japanese)
- Personal Information Protection Commission, alert on large-scale leaks, 7 October 2026 (Japanese) · ScanNetSecurity on the alert (Japanese)
- FSA, request to financial institutions, 9 October 2026 (Japanese)
Organisations' notices
- EPARK Relax & Esthe (Japanese) · LEAN BODY (Japanese) · Helpfeel, Gyazo (Japanese)
- Daiwa Securities, TDnet (Japanese, PDF) · Citizen Watch (Japanese)
- IDC Frontier, first report (Japanese) · SourceNext (Japanese)
- Commune (Japanese) · Studio (Japanese) · Digital Agency (Japanese) · Capcom (Japanese) · FutureShop (Japanese) · Lindt Japan (Japanese)
- Sagawa Express's fifth report, via INTERNET Watch (Japanese) and Impress Watch (Japanese)
- Every notice in the dataset is linked in the CSV, 108 of them with a second source; our breach review sets many of them out in tables.
Risk frameworks and data
- Basel Committee, Principles for the sound management of third-party risk, December 2025 (PDF) · press release
- Basel framework, OPE30: advanced measurement approaches · FSI summary of the standardised approach
- Regulation (EU) 2022/2554 (DORA)
- FSA, cybersecurity in the financial sector (Japanese) · PwC Japan on its third-party section (Japanese)
- NIST SP 800-161r1 · The Open Group, Open FAIR risk taxonomy
- SEC, Form 8-K Item 1.05, July 2023 · Help Net Security on Verizon's 2026 DBIR · VERIS Community Database
This is independent editorial analysis of public statements and our own dataset, not an investigation of any incident and not financial advice.